Fig. 6
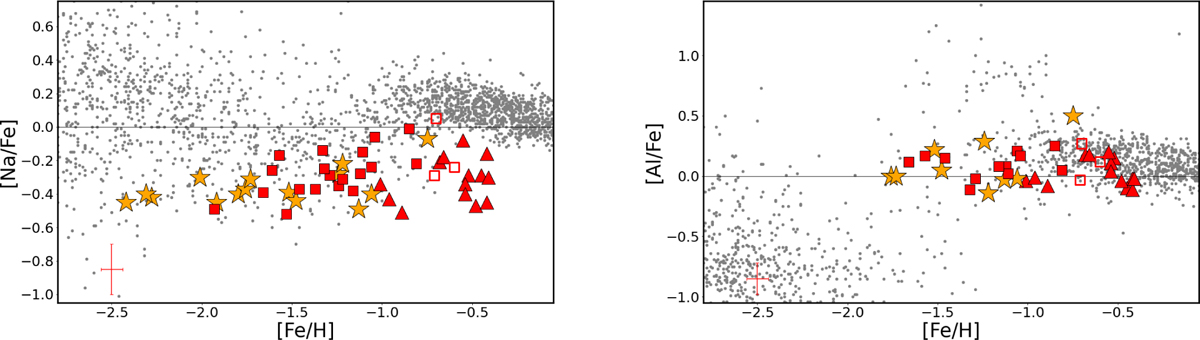
Download original image
Behaviour of [Na/Fe] and [Al/Fe] as a function of [Fe/H] for the Sgr spectroscopic targets of this study (same symbols as in Fig. 1), in comparison with the abundances of MW GCs analysed by Mucciarelli et al. (2023b, orange star symbols) and with the MW field stars from the SAGA database (Suda et al. 2008, grey circles). The empty red squares are the metal-rich Sgr targets belonging to the blue side of Sgr RGB (see Section 4). The typical errorbar of the abundance ratios measured for Sgr stars is shown in the bottom left corner.
Current usage metrics show cumulative count of Article Views (full-text article views including HTML views, PDF and ePub downloads, according to the available data) and Abstracts Views on Vision4Press platform.
Data correspond to usage on the plateform after 2015. The current usage metrics is available 48-96 hours after online publication and is updated daily on week days.
Initial download of the metrics may take a while.