Fig. 8.
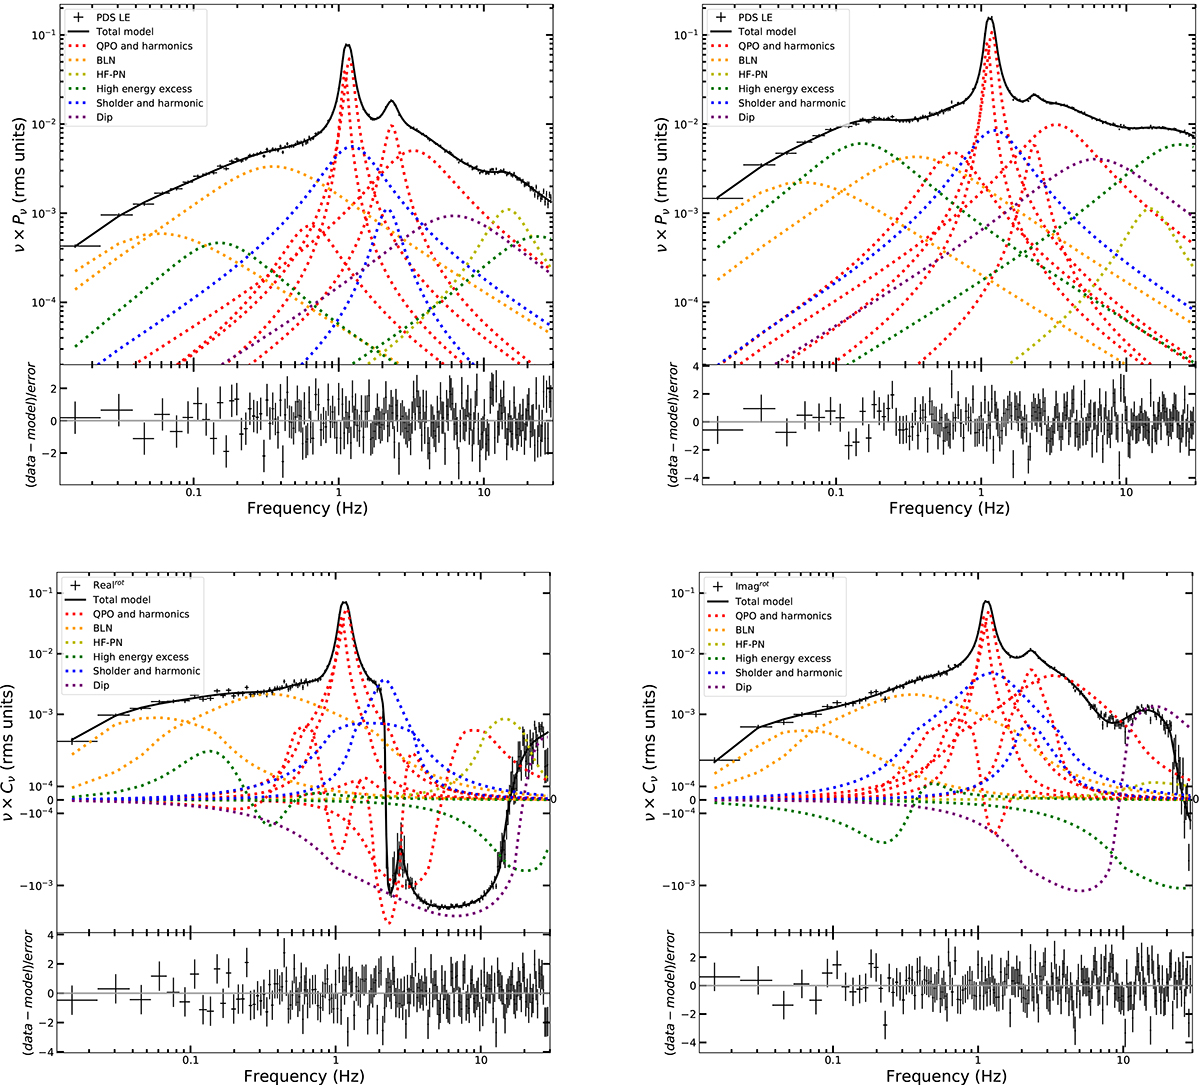
Download original image
LE 2–10 keV (upper-left panel) and HE 28–200 keV PDS (upper-right panel), and the real (lower-left panel) and imaginary (lower-right panel) parts of the rotated CS of Swift J1727.8–1613 for Group #9 in Fig. 4, fit with a model (solid lines) consisting of 13 Lorentzians. Individual components are plotted with colored dotted lines. The fits were done assuming the Gaussian phase-lag model.
Current usage metrics show cumulative count of Article Views (full-text article views including HTML views, PDF and ePub downloads, according to the available data) and Abstracts Views on Vision4Press platform.
Data correspond to usage on the plateform after 2015. The current usage metrics is available 48-96 hours after online publication and is updated daily on week days.
Initial download of the metrics may take a while.