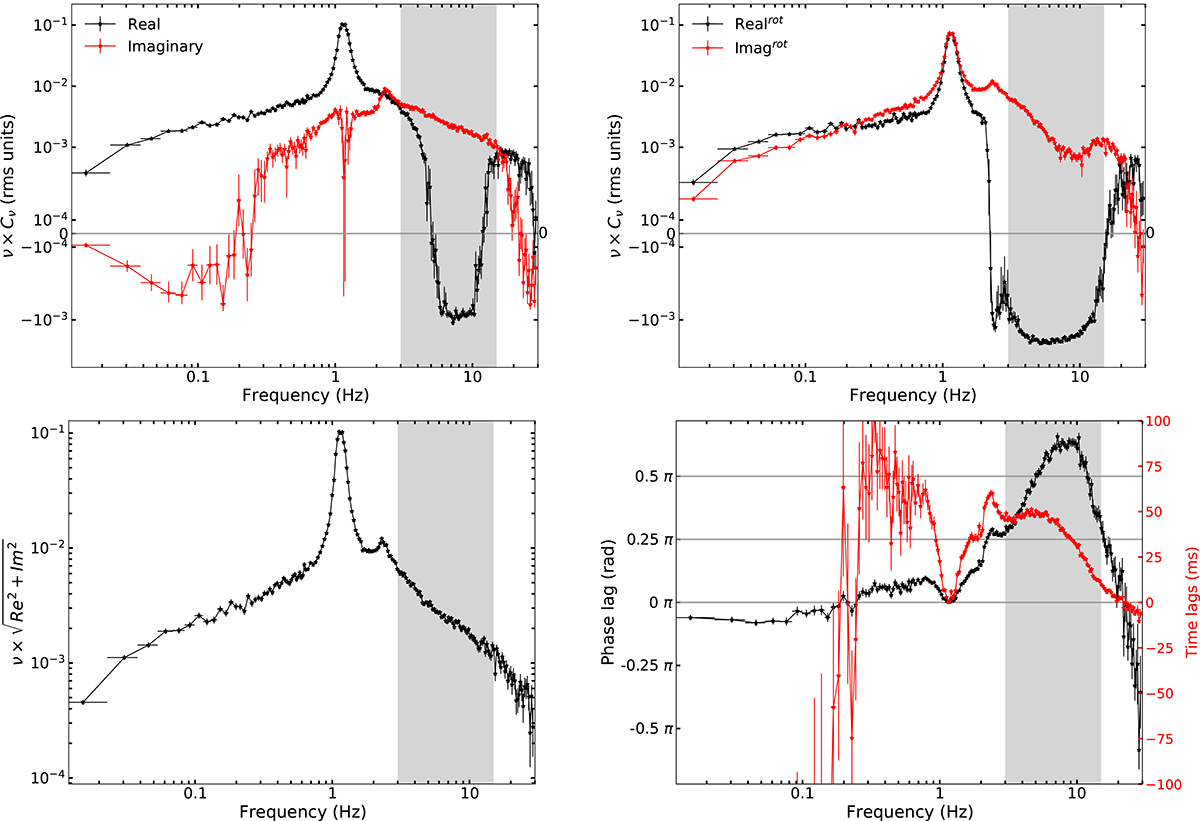
Fig. 5.
Download original image
Top left: Real and imaginary parts of the cross spectrum of Swift J1727.8–1613 for Group #9 in Fig. 4. Top right: Real and imaginary parts of the cross spectrum rotated counterclockwise by 45°. Bottom left: Modulus of the cross spectrum. Bottom right: Phase and time lags. For a clear presentation of the real and imaginary parts of the cross spectrum, data in the cross spectrum with absolute values greater than or equal to 5 × 10⁻⁴ are scaled logarithmically, while values with absolute values smaller than 5 × 10⁻⁴ are scaled linearly.
Current usage metrics show cumulative count of Article Views (full-text article views including HTML views, PDF and ePub downloads, according to the available data) and Abstracts Views on Vision4Press platform.
Data correspond to usage on the plateform after 2015. The current usage metrics is available 48-96 hours after online publication and is updated daily on week days.
Initial download of the metrics may take a while.