Fig. 9.
Download original image
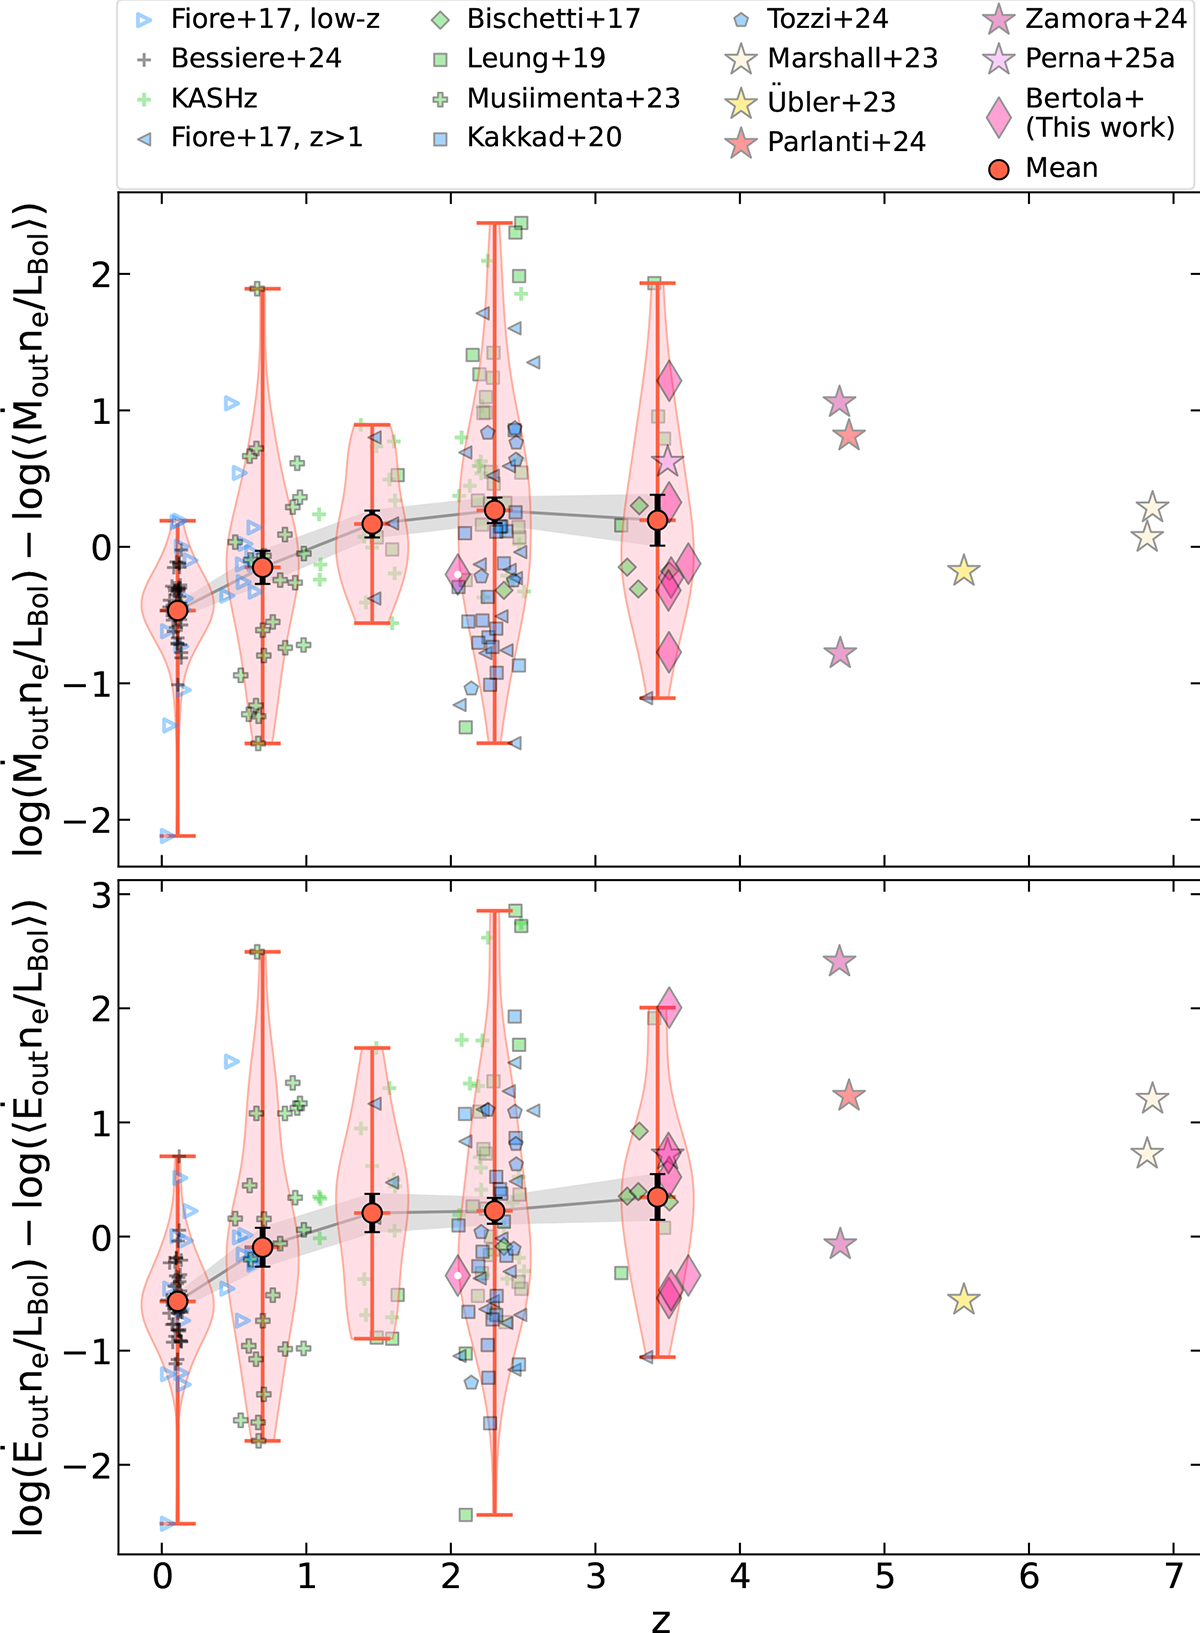
Ratio of mass outflow rate times gas density over bolometric luminosity (top) and ratio of kinetic power times gas density over bolometric luminosity (bottom), normalized to their sample means, versus redshift. Samples and color coding are the same as Fig. 6. Violin plots show the distribution in each considered redshift bin, red circles mark the mean of each redshift bin and black vertical error bars mark the standard deviation of the mean. Points at z>4 are shown to highlight the few measurements available. We note that only other two AGNi at z>4 were observed by JWST (Loiacono et al. 2024; Suh et al. 2025) and are not part of the plot due to the impossibility of homogenizing their measurements with our assumptions in Sect. 6.2.
Current usage metrics show cumulative count of Article Views (full-text article views including HTML views, PDF and ePub downloads, according to the available data) and Abstracts Views on Vision4Press platform.
Data correspond to usage on the plateform after 2015. The current usage metrics is available 48-96 hours after online publication and is updated daily on week days.
Initial download of the metrics may take a while.