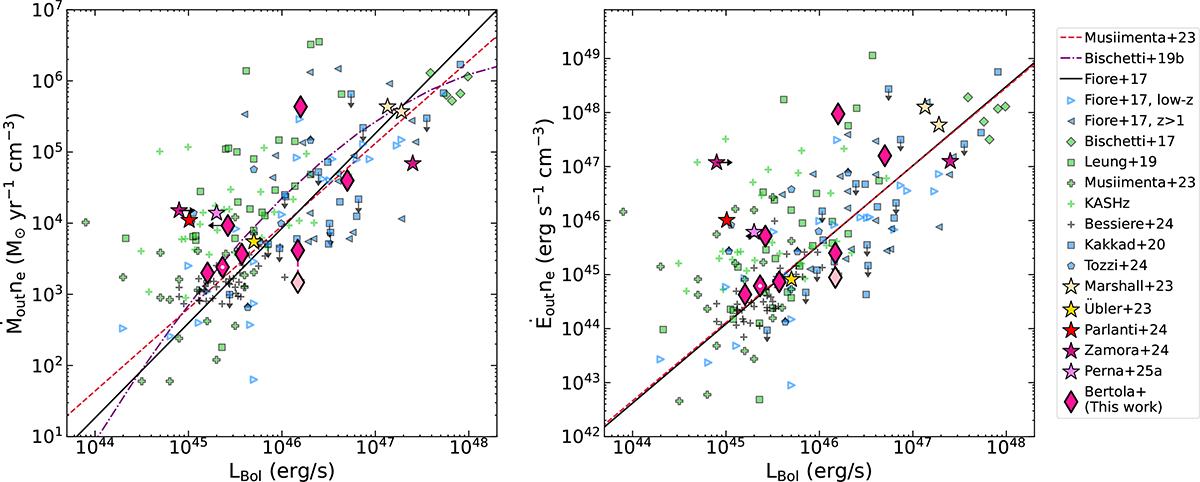
Fig. 6.
Download original image
Comparison of outflow properties of GA-NIFSCOS-AGNi and literature samples in units of gas density. Left: Mass outflow rate against AGN bolometric luminosity. Right: Kinetic power as a function of AGN bolometric luminosity. The color coding of the single measurements is as in Fig. 1. Black solid lines mark the best-fit relation of Fiore et al. (2017), the purple dash-dotted line marks that from Bischetti et al. (2019b) and the red dashed lines mark the best fit relation of Musiimenta et al. (2023). We mark COS2949 with an additional white dot, being the only target at z<3.5 in our sample. Pink diamonds show the outflow properties of COS349 as computed from the [O III] line and the magenta dashed line connects them with the estimates from the Hα line.
Current usage metrics show cumulative count of Article Views (full-text article views including HTML views, PDF and ePub downloads, according to the available data) and Abstracts Views on Vision4Press platform.
Data correspond to usage on the plateform after 2015. The current usage metrics is available 48-96 hours after online publication and is updated daily on week days.
Initial download of the metrics may take a while.