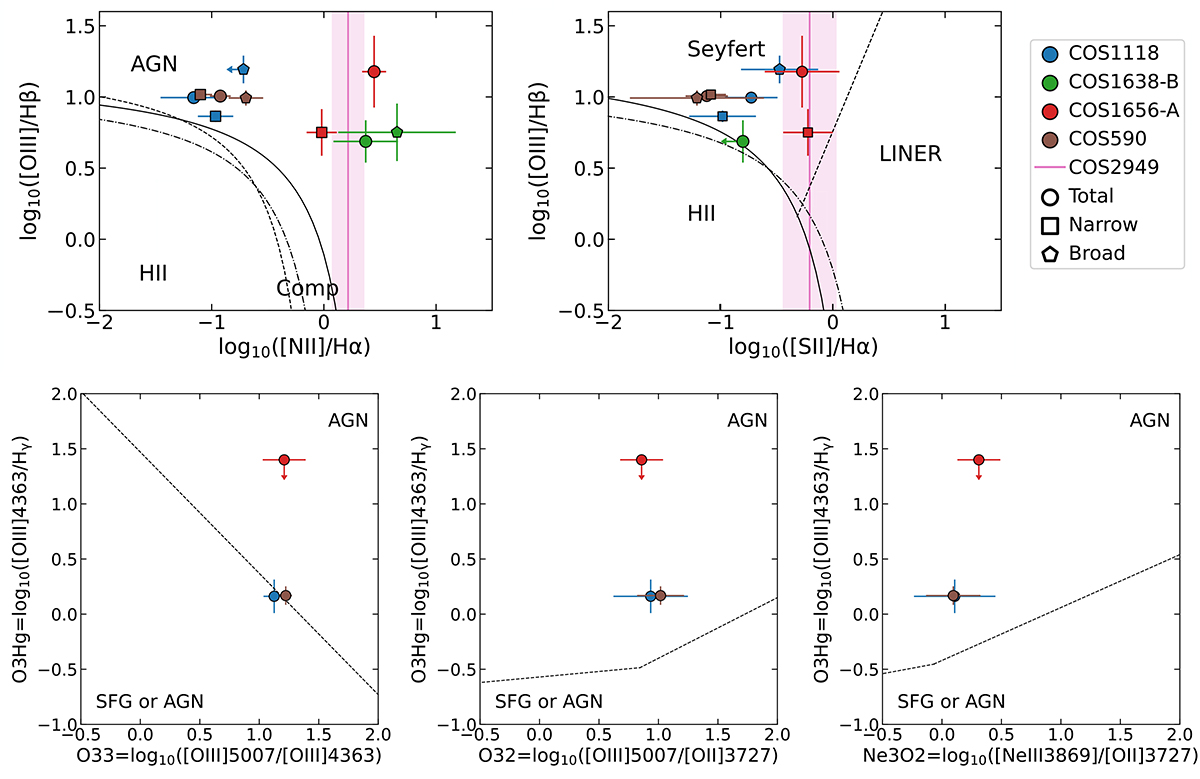
Fig. 5.
Download original image
Diagnostic diagrams. Top, left to right: Standard optical log([O III]/Hβ) versus log([N II]/Hα) and log([O III]/Hβ) versus log([S II]/Hα) diagnostic diagrams. Different ionization regimes are separated by solid and dashed black lines, taken from Kewley et al. (2001, 2006) and Kauffmann et al. (2003). Dashed-dotted black lines show the observed position of z≃2−3 star-forming galaxies in Strom et al. (2017). Bottom, left to right: Diagnostic diagrams log([O III]λ4363Å/Hγ) versus log([O III]λ5007Å/[O III]λ4363Å), log([O III]λ4363Å/Hγ) versus log([O III]λ5007Å/[O II]λ3727Å), and log([O III]λ4363Å/Hγ) versus log([Ne III]λ3869Å/[O II]λ3727Å) and demarcation lines from Mazzolari et al. (2024). Total, narrow, and outflow component line fluxes are shown as circles, squares, and pentagons. COS2949 is marked as a pink line since NIRSpec/IFU data do not cover the Hβ+[O III] range. Error bars are dominated by the uncertainties resulting from extinction correction.
Current usage metrics show cumulative count of Article Views (full-text article views including HTML views, PDF and ePub downloads, according to the available data) and Abstracts Views on Vision4Press platform.
Data correspond to usage on the plateform after 2015. The current usage metrics is available 48-96 hours after online publication and is updated daily on week days.
Initial download of the metrics may take a while.