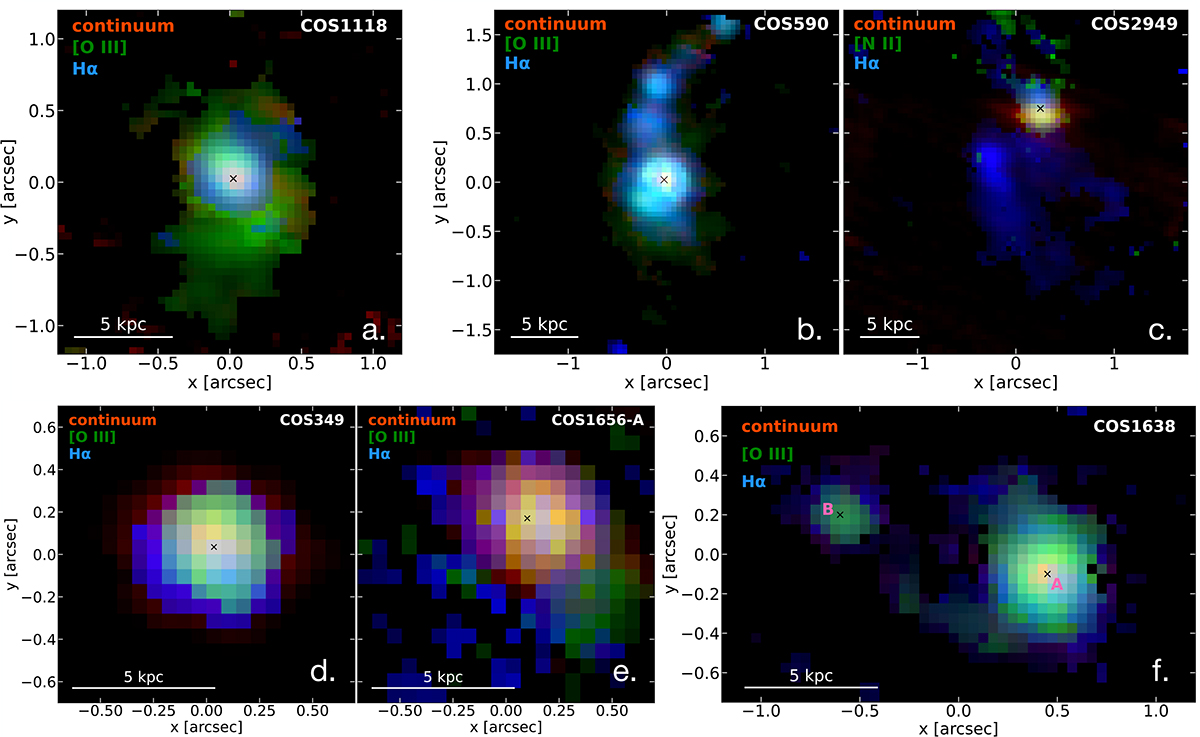
Fig. 2.
Download original image
Three-color images of COS-AGNi from GA-NIFS: Panel a. COS1118; Panel b. COS590; Panel c. COS1949; Panel d. COS349; Panel e. COS1656-A; and Panel f. COS1638-A (right) and -B (left). Red is the continuum, green is total [O III] emission, and blue is total Hα emission. For COS2949, green is total [N II] emission, to highlight the position of the AGN. Black crosses mark the position of the AGN. The continuum of COS1118, COS1656-A and COS2949 is measured over the full range probed by NIRSpec (≃3500−7000 Å for the first two, 6500−10 000 Å for the latter), after masking the emission lines. The continuum of COS1638-A and COS349 is measured in the ≃5500−6300 Å range because lower wavelengths are affected by strong Fe II emission. The continuum of COS590 is measured in the ≃3500–5200 Å range to exclude the noisier channels of the cube. For this target, we also subtract the field noise in the continuum map as the median of the signal for each pixel column.
Current usage metrics show cumulative count of Article Views (full-text article views including HTML views, PDF and ePub downloads, according to the available data) and Abstracts Views on Vision4Press platform.
Data correspond to usage on the plateform after 2015. The current usage metrics is available 48-96 hours after online publication and is updated daily on week days.
Initial download of the metrics may take a while.