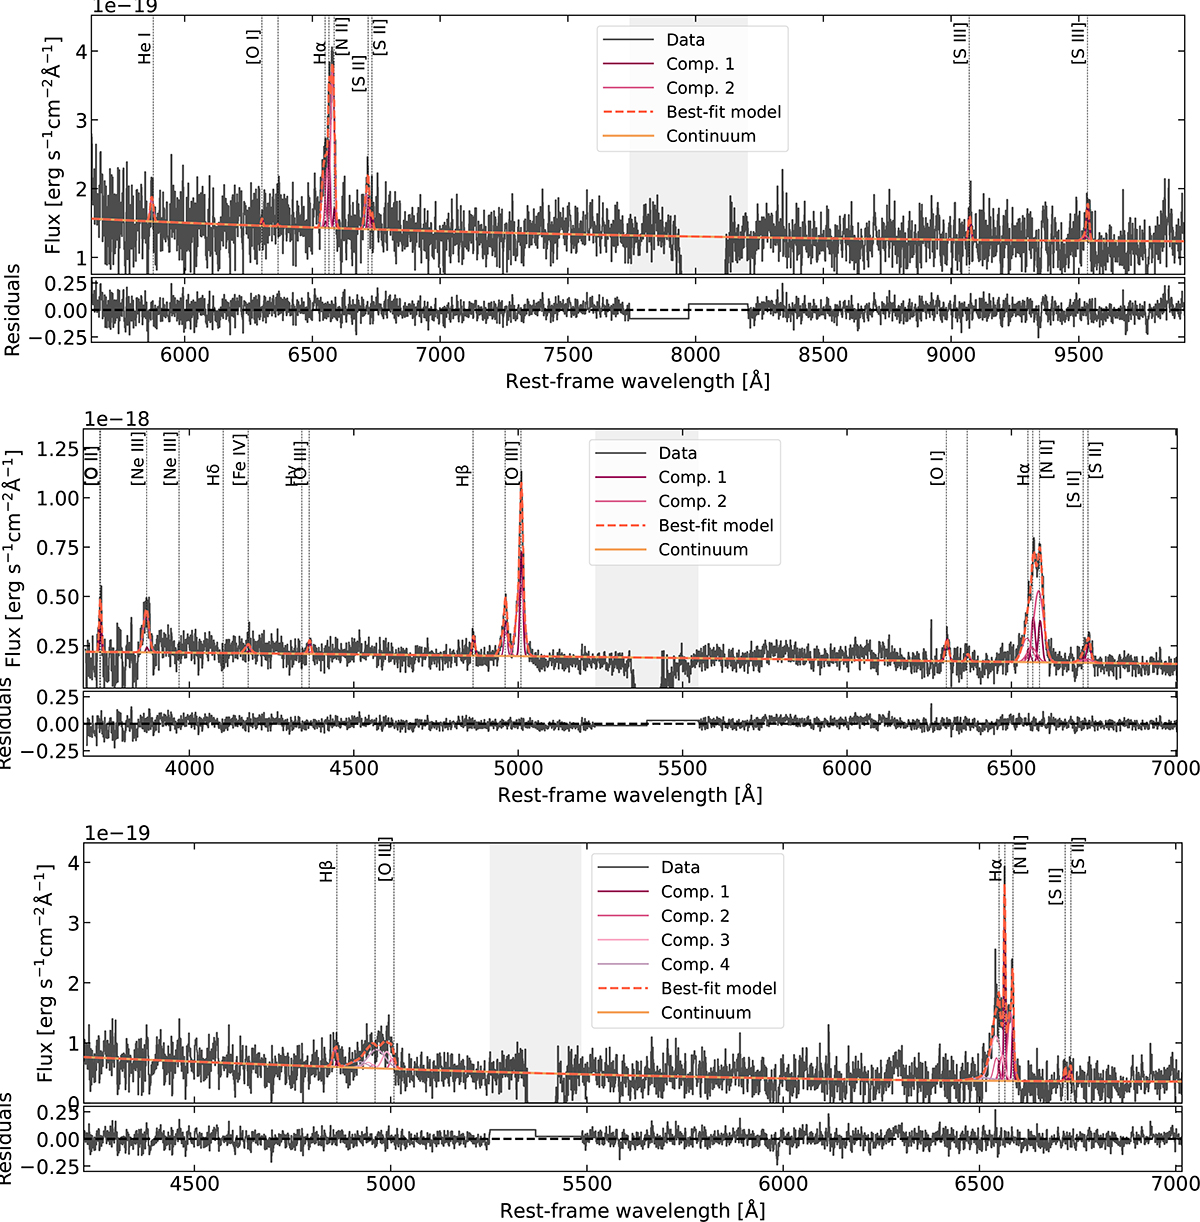
Fig. A.3.
Download original image
Spectra and best-fit models of COS2949 (Top), COS1656-A (Middle) and COS1638-B (Bottom) integrated over the outflow region (S/N>3 mask of the broad emission). Data and residuals are in black, total model is in dashed red, continuum is in orange, additional Gaussian emission line components are shown as dark to light purple. The gray shaded region marks the wavelength range that was excluded in the fitting process.
Current usage metrics show cumulative count of Article Views (full-text article views including HTML views, PDF and ePub downloads, according to the available data) and Abstracts Views on Vision4Press platform.
Data correspond to usage on the plateform after 2015. The current usage metrics is available 48-96 hours after online publication and is updated daily on week days.
Initial download of the metrics may take a while.