Fig. 1.
Download original image
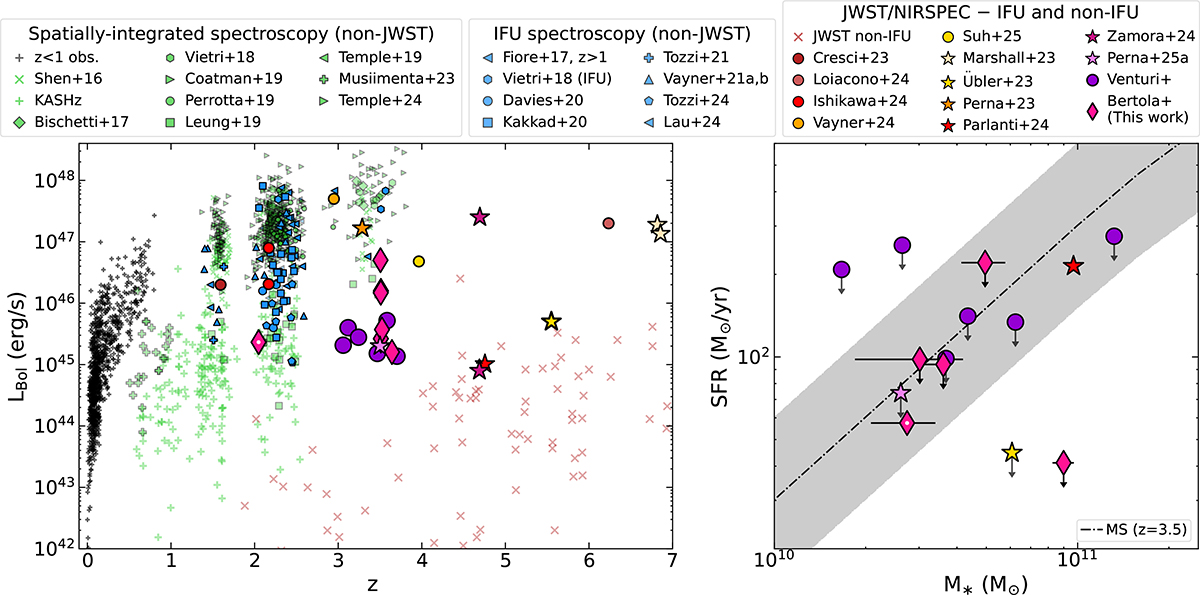
General properties of GA-NIFSAGNi and summary of IFS observations from the literature. Left: Bolometric luminosity versus redshift distribution of the COS-AGNi presented in this work (magenta diamonds). Building on the compilations of Fiore et al. (2017) and Circosta et al. (2018) (see their Fig. 1), we also show literature AGN for which optical rest-frame spectroscopy is available and has allowed ionized outflows to be probed, to highlight the new bolometric luminosity range probed by GA-NIFS AGNi at z>3. Literature targets are color-coded as follows: a (non-exhaustive) compilation of AGNi at z<1 is shown as black crosses (see Sect. 2); AGN studied through spatially integrated spectra are shown as green symbols (see legend and Sect. 2 for details); AGNi studied through IFS data are shown as blue symbols (see legend and Sect. 2 for details). Stars and circles mark JWST/NIRSpec IFU observations from GA-NIFS and other surveys, respectively (see legend and Sect. 2 for details). GOODS-S AGNi from GA-NIFS that will be presented in Venturi et al. in prep are shown as purple circles. Red x signs show a compilation of AGNi and AGNi candidates newly discovered by JWST through spatially integrated NIRSpec spectra (Scholtz et al. 2025; Maiolino et al. 2024; Harikane et al. 2023; Kocevski et al. 2023; Carnall et al. 2023; Greene et al. 2024; Furtak et al. 2024; Chisholm et al. 2024). Right: Star formation rate versus stellar mass plot of GA-NIFS AGNi to show their relation with the main sequence of star forming galaxies. Both quantities are measured from SED fitting. Color coding is the same as the left panel. A white dot marks COS2949, the COS-AGNi at z≃2.05. The black dash-dotted line is the main sequence of Schreiber et al. (2015) at z = 3.5, with the shaded area showing the 0.3 dex scatter.
Current usage metrics show cumulative count of Article Views (full-text article views including HTML views, PDF and ePub downloads, according to the available data) and Abstracts Views on Vision4Press platform.
Data correspond to usage on the plateform after 2015. The current usage metrics is available 48-96 hours after online publication and is updated daily on week days.
Initial download of the metrics may take a while.