Fig. 9
Download original image
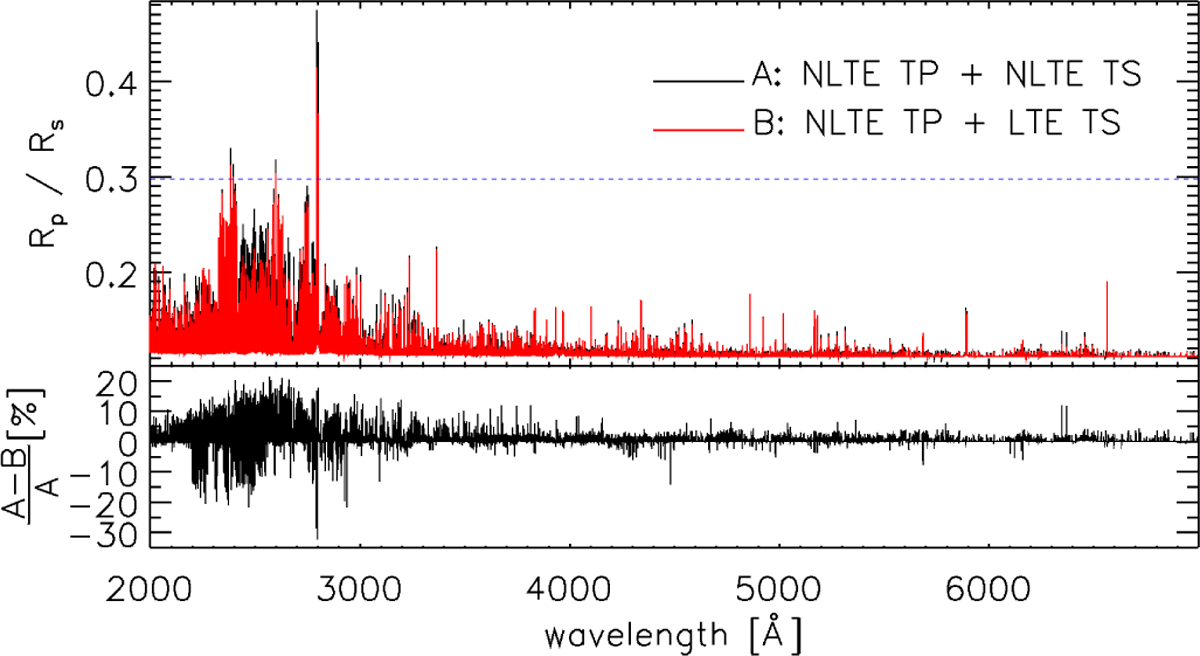
Comparison between theoretical transmission spectra computed with full NLTE (A; black; same as the black line in Figure 8), namely the NLTE TP profile and accounting for NLTE effects for the computation of the transmission spectrum (TS), and with partial NLTE (B, red), namely NLTE TP profile and assuming LTE for the computation of the transmission spectrum, at a resolution of 100 000 in the NUV and optical range. The bottom panel shows the relative difference between the two spectra in percent. In the top panel, the blue horizontal dashed line indicates the location of the Roche radius in the planetary limb direction.
Current usage metrics show cumulative count of Article Views (full-text article views including HTML views, PDF and ePub downloads, according to the available data) and Abstracts Views on Vision4Press platform.
Data correspond to usage on the plateform after 2015. The current usage metrics is available 48-96 hours after online publication and is updated daily on week days.
Initial download of the metrics may take a while.