Fig. 8
Download original image
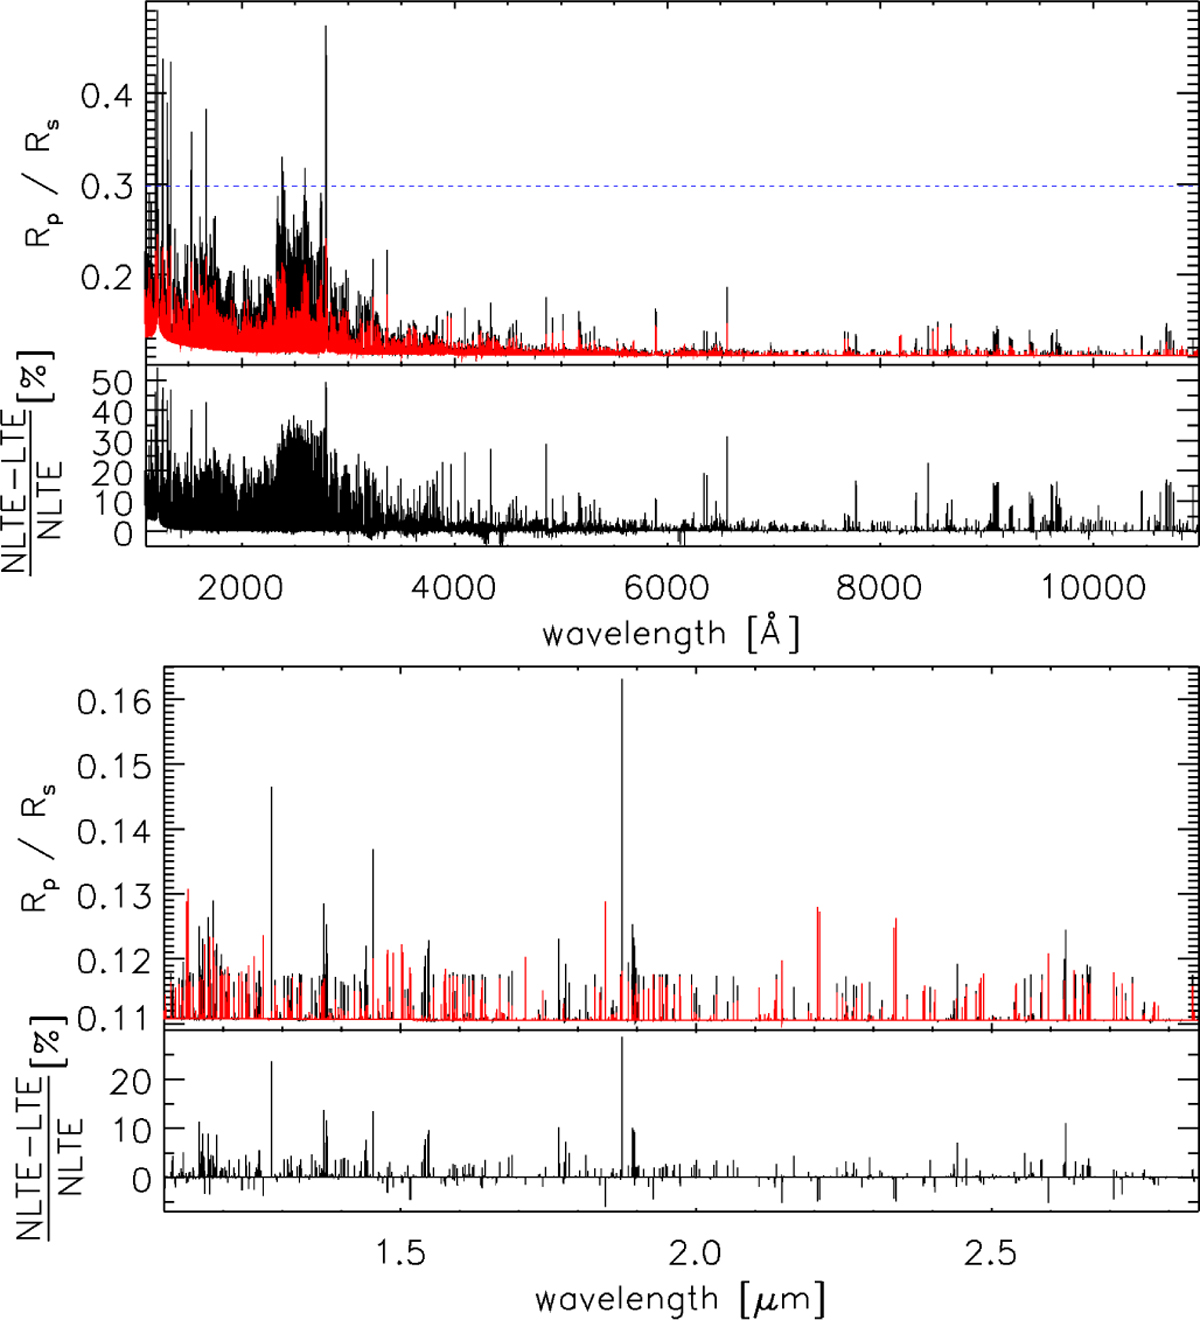
Comparison between the theoretical LTE (red) and NLTE (black) transmission spectra computed at a resolution of 100 000 in the UV and optical range (top) and in the near-infrared (bottom). Within each plot, the bottom panel shows the relative difference between LTE and NLTE (in percent). In the top panel, the blue horizontal dashed line indicates the location of the Roche radius in the planetary limb direction (i.e. perpendicular to the star-planet connecting line).
Current usage metrics show cumulative count of Article Views (full-text article views including HTML views, PDF and ePub downloads, according to the available data) and Abstracts Views on Vision4Press platform.
Data correspond to usage on the plateform after 2015. The current usage metrics is available 48-96 hours after online publication and is updated daily on week days.
Initial download of the metrics may take a while.