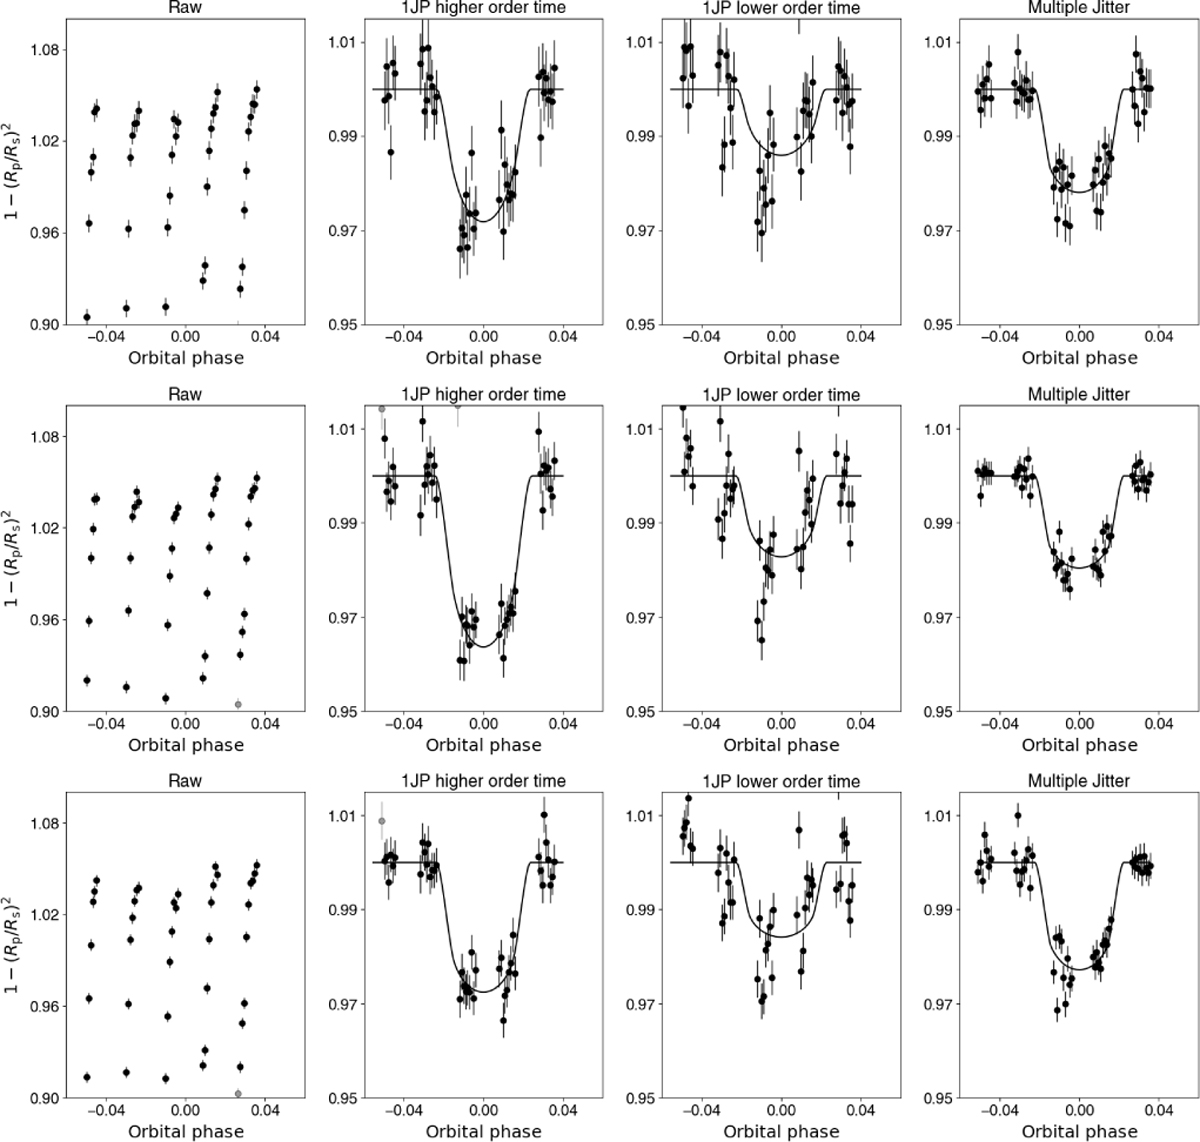
Fig. B.3
Download original image
Light curves extracted from the STIS data for three spectral orders located around the beginning (21st spectral order; 2326.7–2365.8 Å; top), middle (11th spectral order; 2629.1-2673.3 Å; middle), and end (2nd spectral order; 2977.4–3027.3 Å; bottom) of the range covered by the data. Within each plot, the left panel is for the raw light curve, the two middle panels are for the data analysed using the ‘one jitter parameter’ (high and low polynomial order in time) analysis method, and the right panel is for the data analysed using the ‘multiple jitter parameter’ analysis method.
Current usage metrics show cumulative count of Article Views (full-text article views including HTML views, PDF and ePub downloads, according to the available data) and Abstracts Views on Vision4Press platform.
Data correspond to usage on the plateform after 2015. The current usage metrics is available 48-96 hours after online publication and is updated daily on week days.
Initial download of the metrics may take a while.