Fig. B.2
Download original image
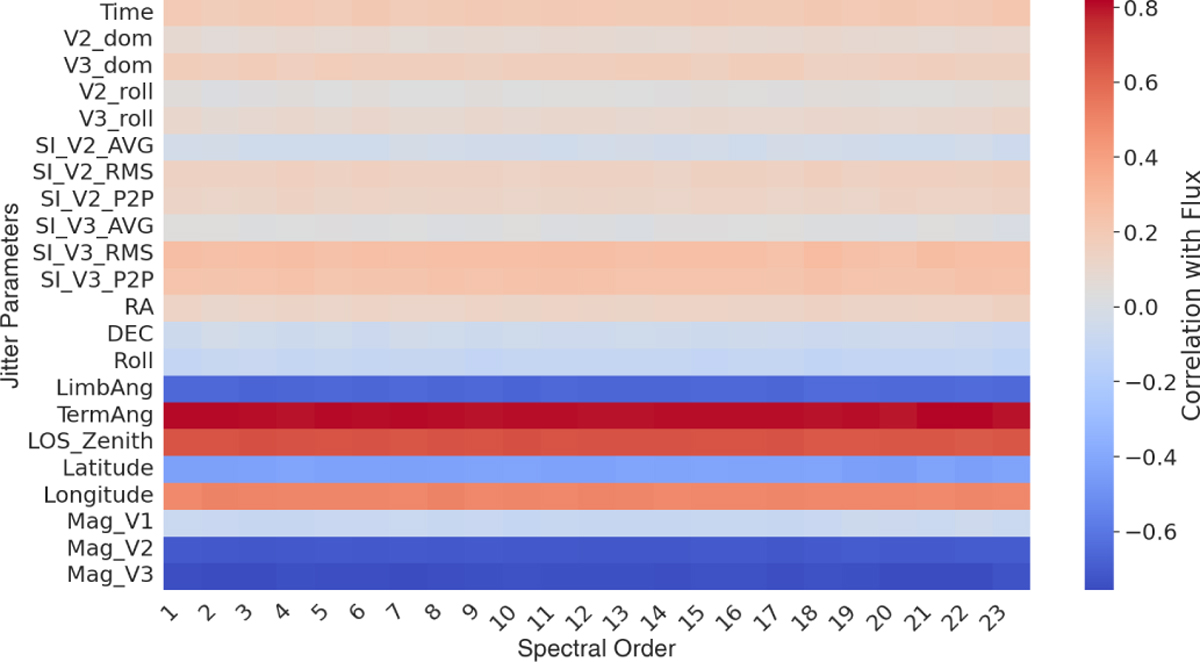
Heat map showing the correlation of jitter parameters and time with flux across each spectral order. The x-axis represents the spectral order, while the y-axis lists the parameters. The colour indicates the strength of the correlation, with red and blue representing positive and negative correlations, respectively, as indicated by the colour bar on the right hand side.
Current usage metrics show cumulative count of Article Views (full-text article views including HTML views, PDF and ePub downloads, according to the available data) and Abstracts Views on Vision4Press platform.
Data correspond to usage on the plateform after 2015. The current usage metrics is available 48-96 hours after online publication and is updated daily on week days.
Initial download of the metrics may take a while.