Fig. 14
Download original image
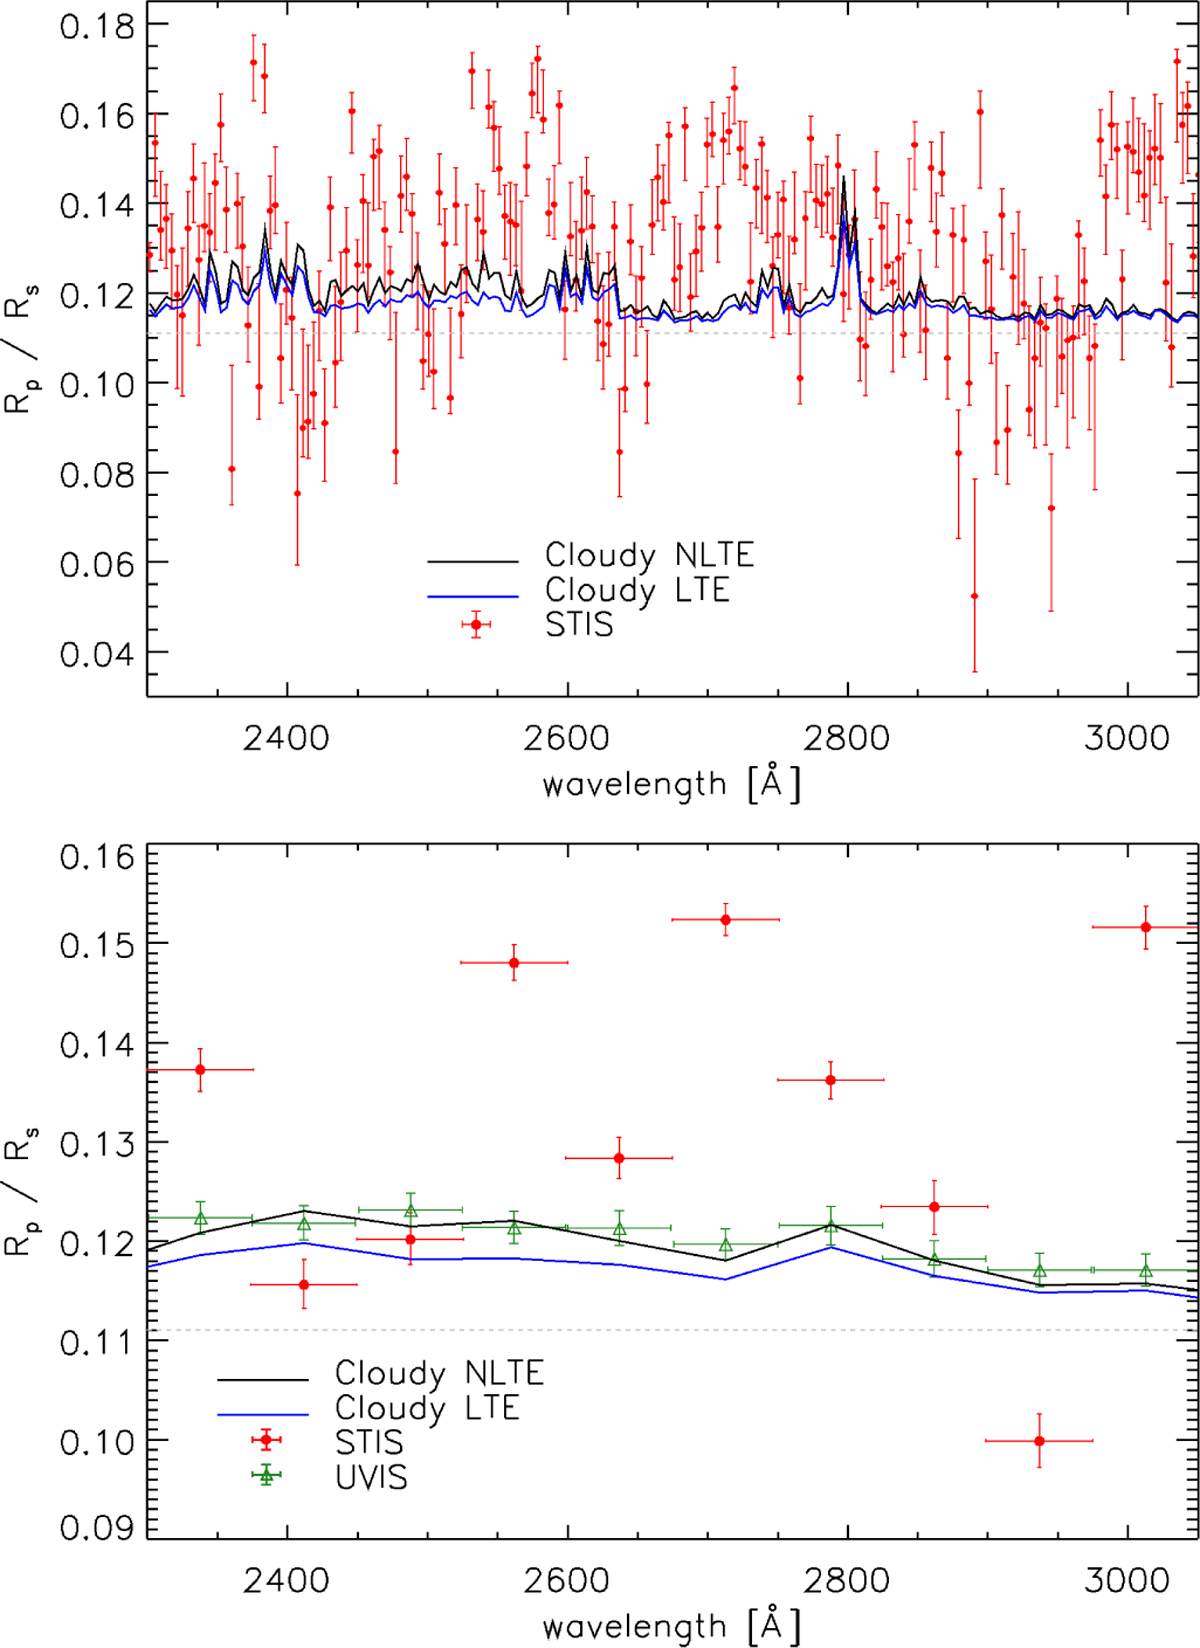
Comparison between observed and synthetic transmission spectra in the region covered by the STIS data. Top: mid-resolution (≈9 Å binning) STIS transmission spectrum is shown with red points. Bottom: low-resolution (≈74 Å binning) STIS and UVIS transmission spectra are shown with the red circles and green triangles, respectively. In both panels, the blue and black lines show the LTE and NLTE synthetic transmission spectra, respectively, while the grey horizontal dashed line indicates the broad-band Rp/Rs obtained from the EulerCAM optical transits (Hellier et al. 2019). The horizontal error bars shown for the red and green points correspond to the size of the wavelength bins.
Current usage metrics show cumulative count of Article Views (full-text article views including HTML views, PDF and ePub downloads, according to the available data) and Abstracts Views on Vision4Press platform.
Data correspond to usage on the plateform after 2015. The current usage metrics is available 48-96 hours after online publication and is updated daily on week days.
Initial download of the metrics may take a while.