Fig. 13
Download original image
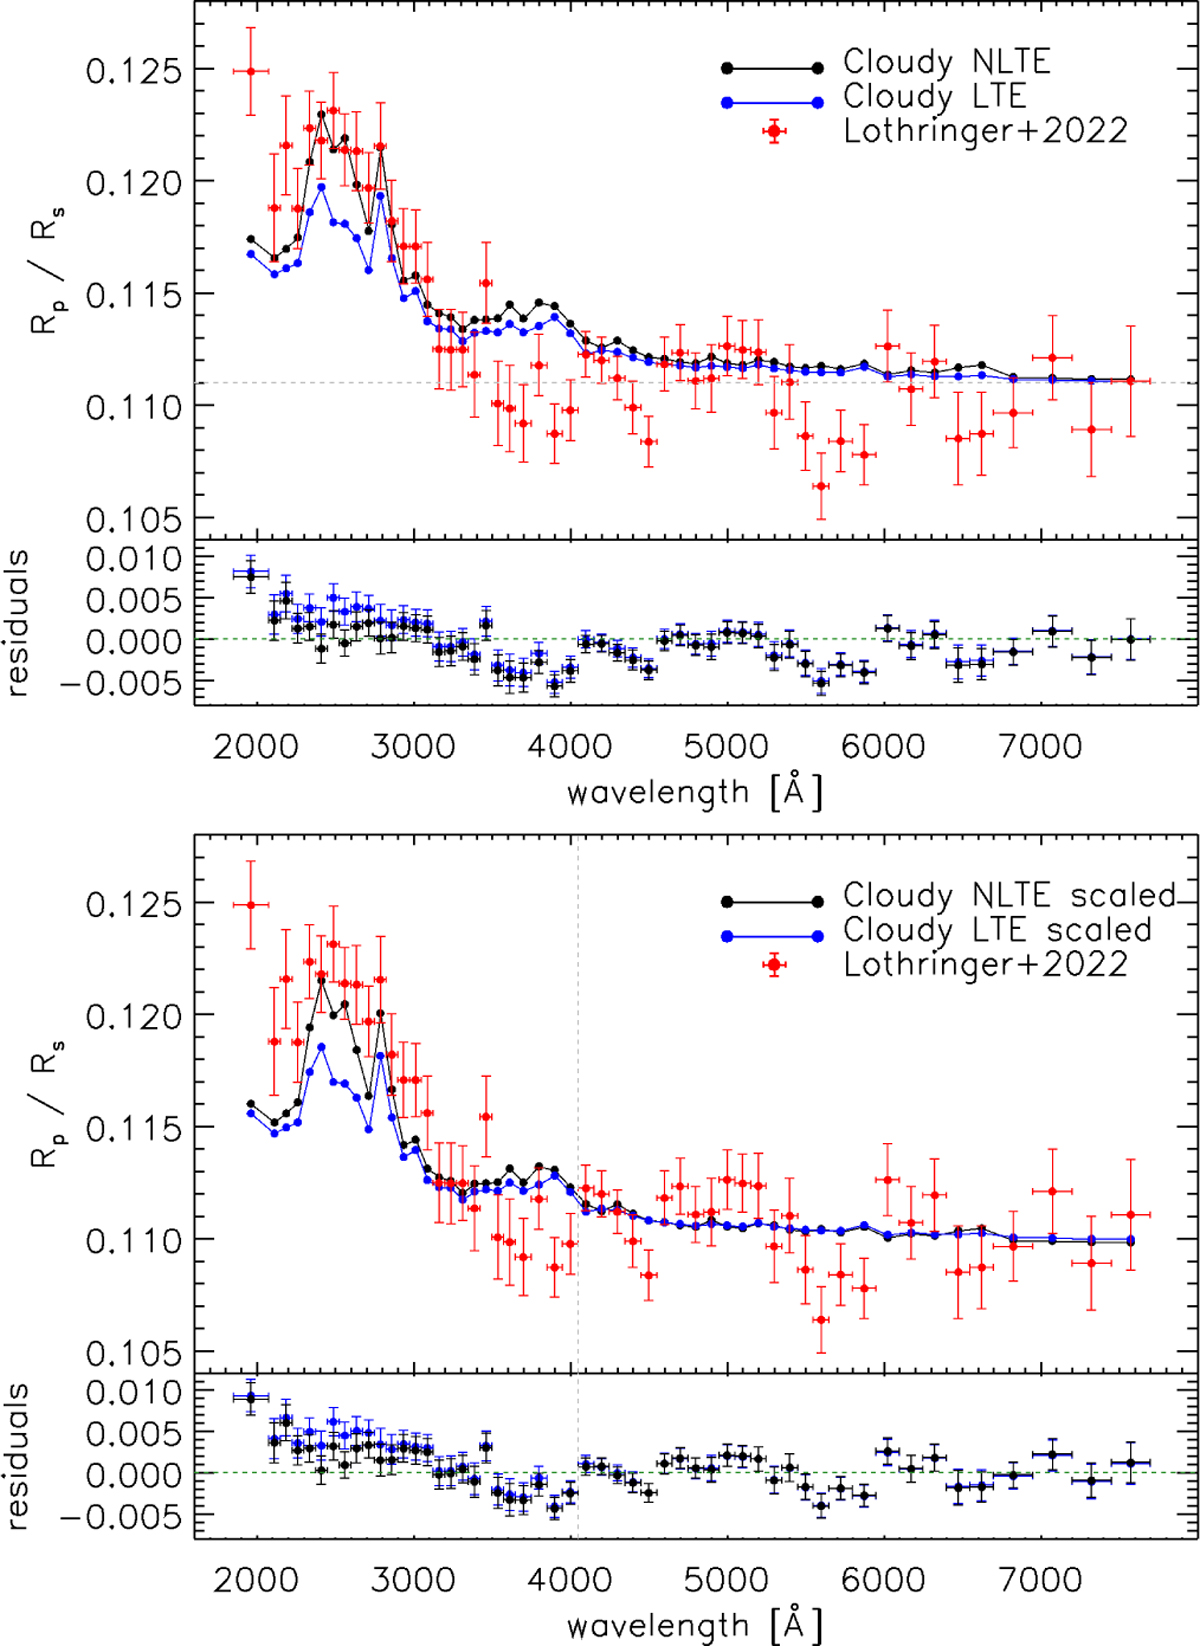
Comparison of the NLTE (black) and LTE (blue) theoretical transmission spectra with the WFC3/UVIS observations published by Lothringer et al. (2022, red). The horizontal error bars shown for the red points correspond to the size of the wavelength bins. The top plot is without scaling of the models, while in the bottom plot the NLTE and LTE models have been scaled to match the average of the UVIS observations at wavelengths longer than 4050 Å, marked by the vertical grey dashed line. In the top plot, the grey horizontal dashed line indicates the broad-band Rp/Rs obtained from the EulerCAM optical transits (Hellier et al. 2019). In each plot, the bottom panel shows the residuals between the observation and each of the models, with a green dashed line at zero for reference.
Current usage metrics show cumulative count of Article Views (full-text article views including HTML views, PDF and ePub downloads, according to the available data) and Abstracts Views on Vision4Press platform.
Data correspond to usage on the plateform after 2015. The current usage metrics is available 48-96 hours after online publication and is updated daily on week days.
Initial download of the metrics may take a while.