Fig. 10
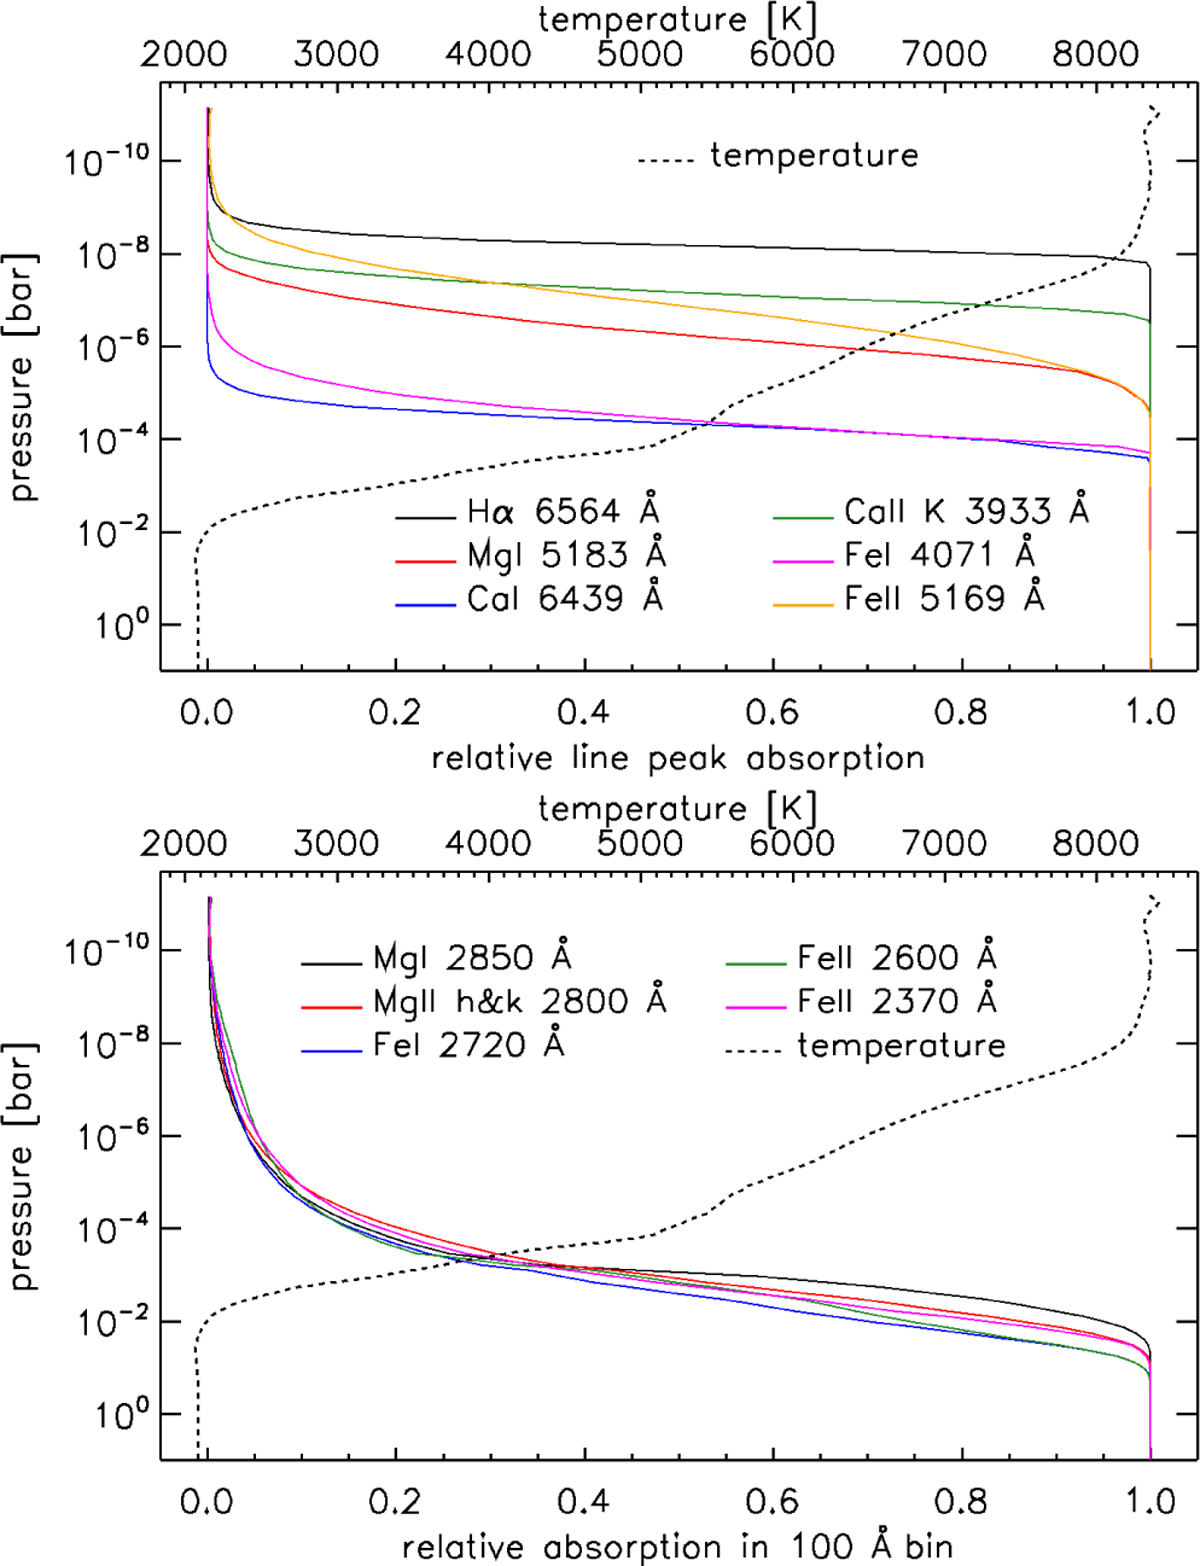
Download original image
Line formation analysis in transmission geometry. Top: relative peak absorption for Hα (black), the MgIb line at ∼5183 Å (red), the Cal line at ∼6439 Å (blue), the Cair K line (green), the FeI line at ∼4071 Å (magenta), and the FeII line at ∼5169 Å (orange). Bottom: relative absorption in a 100 Å spectral bin centered at the MgI resonance line at ∼2850 Å (black), the MgII h&k resonance lines at ∼2800 Å (red), the FeI NUV absorption band at ∼2720 Å (blue), the FeII resonance line at ∼2600 Å (green), and the FeII NUV absorption band at ∼2370 Å (magenta) as a function of pressure. In both panels, the dashed line shows the TP profile (top x-axis). The line formation region corresponds to the pressure values in which the relative absorption ranges between zero and one.
Current usage metrics show cumulative count of Article Views (full-text article views including HTML views, PDF and ePub downloads, according to the available data) and Abstracts Views on Vision4Press platform.
Data correspond to usage on the plateform after 2015. The current usage metrics is available 48-96 hours after online publication and is updated daily on week days.
Initial download of the metrics may take a while.