Fig. 7
Download original image
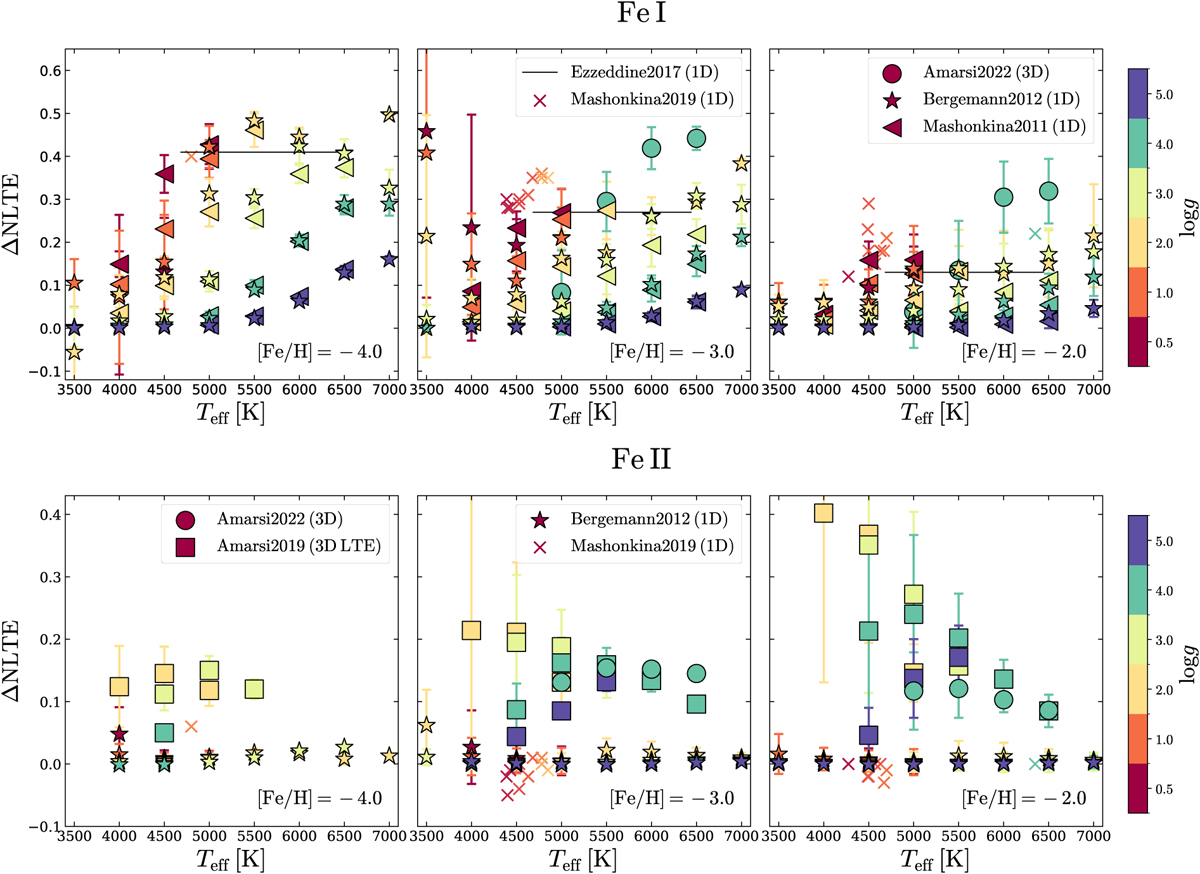
Corrections for Fe I (top) and Fe II (bottom), colour-coded by log g: stars and triangles show 1D NLTE corrections from Bergemann et al. (2012c) and Mashonkina et al. (2011), respectively, and circles show 3D NLTE corrections from Amarsi et al. (2022; available only for dwarf stars). The 1D NLTE corrections for individual stars from Mashonkina et al. (2019a) are shown with crosses (X). The ΔNLTE relation of Ezzeddine et al. (2017) for Fe I is shown with the black line (top row). The squares in the bottom row show the 3D LTE corrections for Fe II from Amarsi et al. (2019). The error bars represent the standard deviation of different lines.
Current usage metrics show cumulative count of Article Views (full-text article views including HTML views, PDF and ePub downloads, according to the available data) and Abstracts Views on Vision4Press platform.
Data correspond to usage on the plateform after 2015. The current usage metrics is available 48-96 hours after online publication and is updated daily on week days.
Initial download of the metrics may take a while.