Fig. 6
Download original image
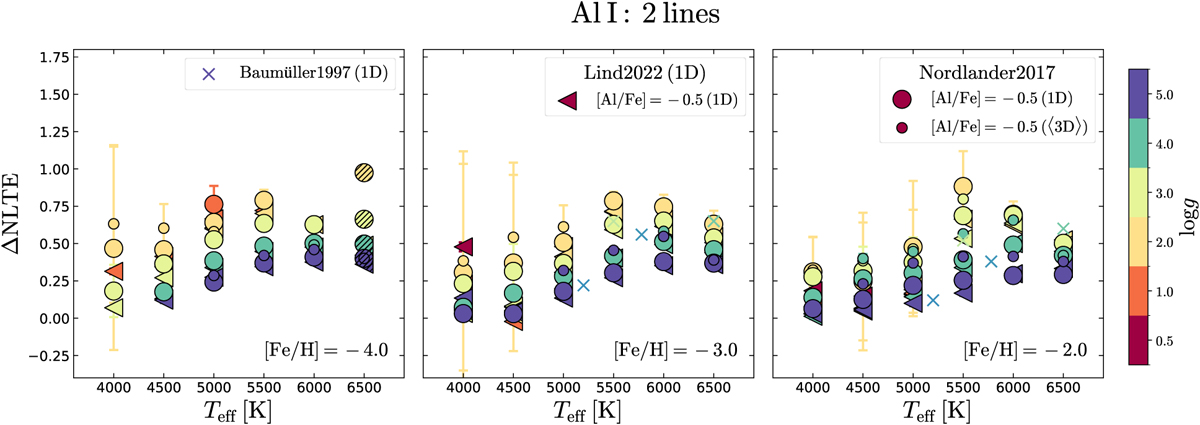
Mean NLTE corrections of the resonance Al I lines at 3944 Å and 3961 Å, colour-coded by log g: triangles are from Lind et al. (2022) and circles from Nordlander & Lind (2017). The corrections for individual stars from Baumueller & Gehren (1997) are shown with crosses (X), for four test cases of Teff = 5200, 5500, 5780, and 6500 K; and log g=4.50, 3.50, 4.44, and 4.00. The error bars represent the standard deviation of the corrections of the two lines (often smaller than the depicted symbols). The hatched symbols indicate corrections that are based on one line.
Current usage metrics show cumulative count of Article Views (full-text article views including HTML views, PDF and ePub downloads, according to the available data) and Abstracts Views on Vision4Press platform.
Data correspond to usage on the plateform after 2015. The current usage metrics is available 48-96 hours after online publication and is updated daily on week days.
Initial download of the metrics may take a while.