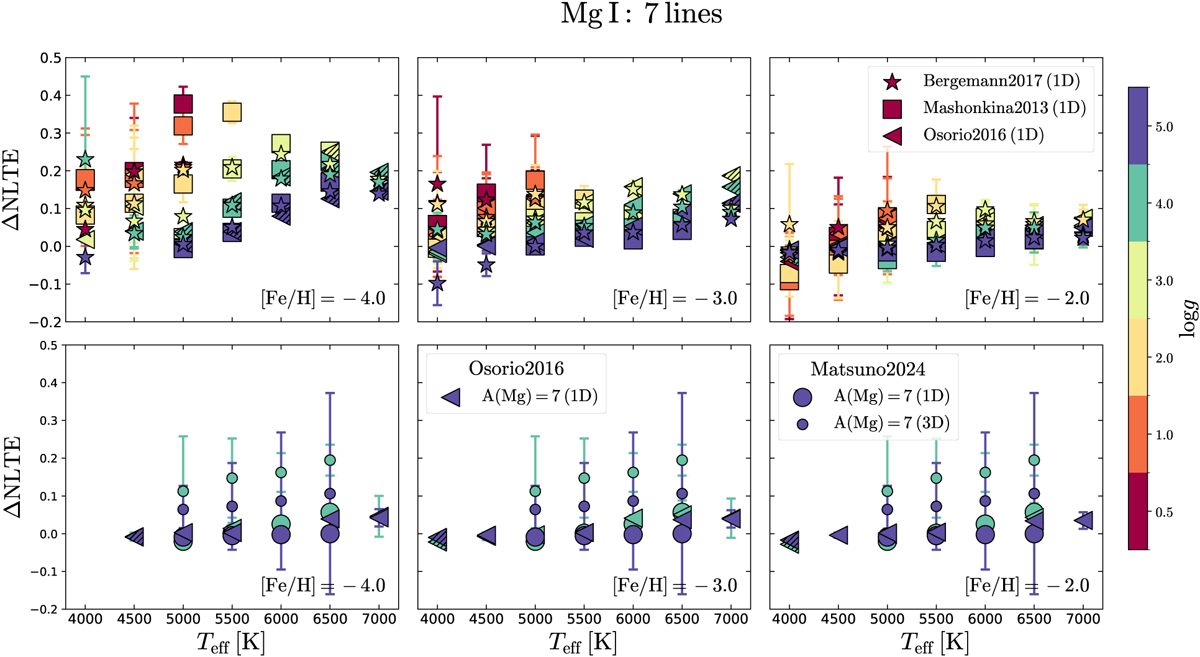
Fig. 5
Download original image
NLTE corrections for Mg I, colour-coded by log g: stars are from Bergemann et al. (2017), squares are from Mashonkina (2013), triangles from Osorio & Barklem (2016), and circles from Matsuno et al. (2024). The top row compares the corrections of Osorio & Barklem (2016) assuming the same EWs as given by Bergemann et al. (2017) and Mashonkina (2013) for each Mg I line, at fixed Teff, log g and [Fe/H] values. The bottom row compares Osorio & Barklem (2016) to the 1D and 3D NLTE corrections of Matsuno et al. (2024), only available for dwarf stars, for A(Mg)=7. The error bars represent the standard deviation of different Mg I lines (often smaller than the depicted symbols); the hatched symbols indicate corrections that are based only on one line.
Current usage metrics show cumulative count of Article Views (full-text article views including HTML views, PDF and ePub downloads, according to the available data) and Abstracts Views on Vision4Press platform.
Data correspond to usage on the plateform after 2015. The current usage metrics is available 48-96 hours after online publication and is updated daily on week days.
Initial download of the metrics may take a while.