Fig. 4
Download original image
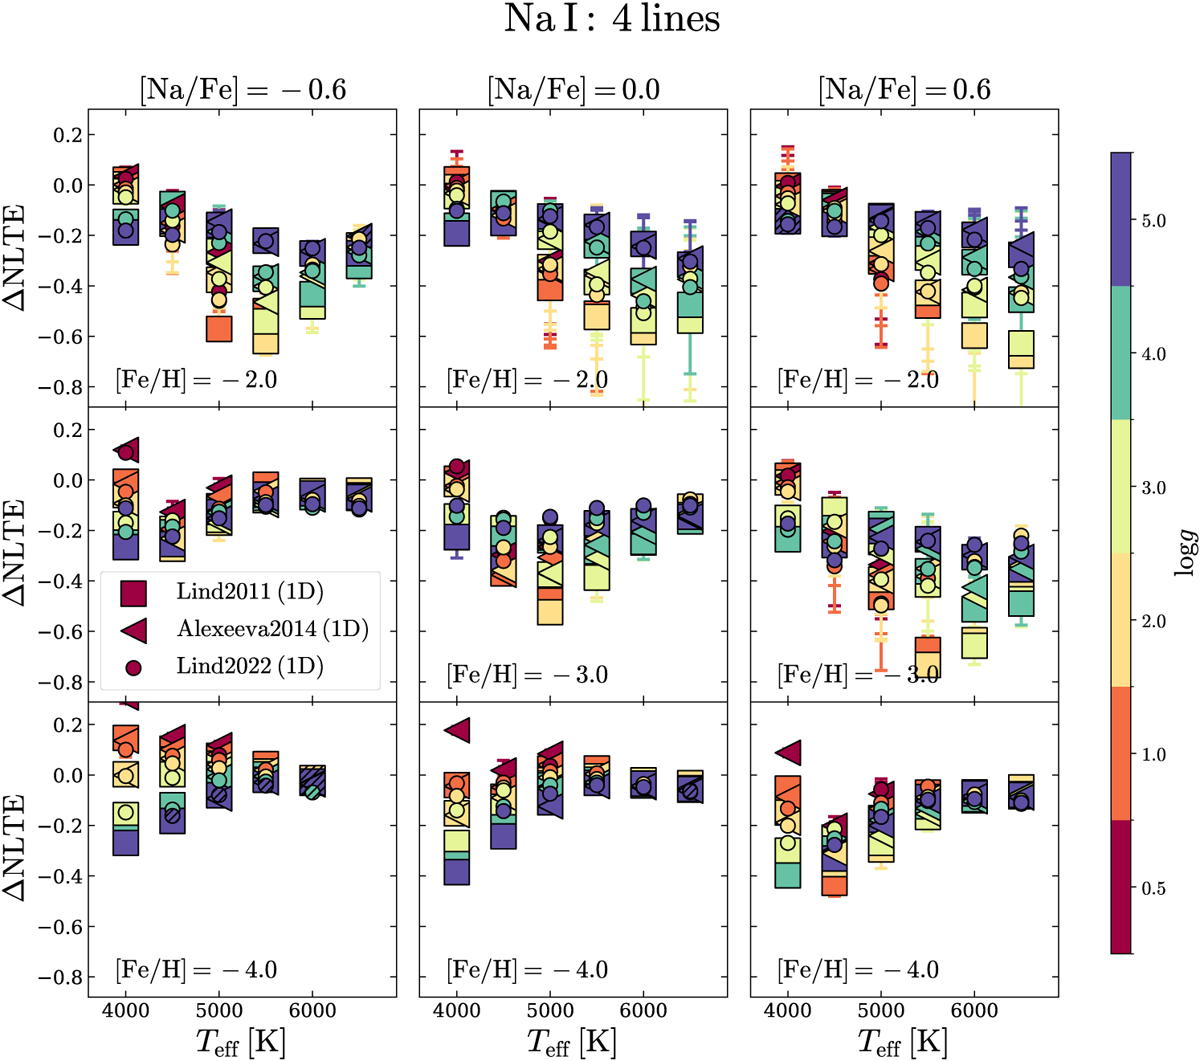
NLTE corrections for Na I, colour-coded by log g: squares are from Lind et al. (2011), triangles from Alexeeva et al. (2014), and circles from Lind et al. (2022). The rows show three metallicities: [Fe/H] = −2 (top), [Fe/H] = −3 (middle), and [Fe/H] = −4 (bottom). The columns show different [Na/Fe] LTE values: [Na/Fe] = −0.6 (left), [Na/Fe] = 0 (middle) and [Na/Fe] = +0.6 (right). The symbols are hatched diagonally in cases where only one line is available (i.e. EW > 5 mÅ). The error bars represent the standard deviation of the NLTE corrections of the different Na I lines at a given set of stellar parameters.
Current usage metrics show cumulative count of Article Views (full-text article views including HTML views, PDF and ePub downloads, according to the available data) and Abstracts Views on Vision4Press platform.
Data correspond to usage on the plateform after 2015. The current usage metrics is available 48-96 hours after online publication and is updated daily on week days.
Initial download of the metrics may take a while.