Fig. 22
Download original image
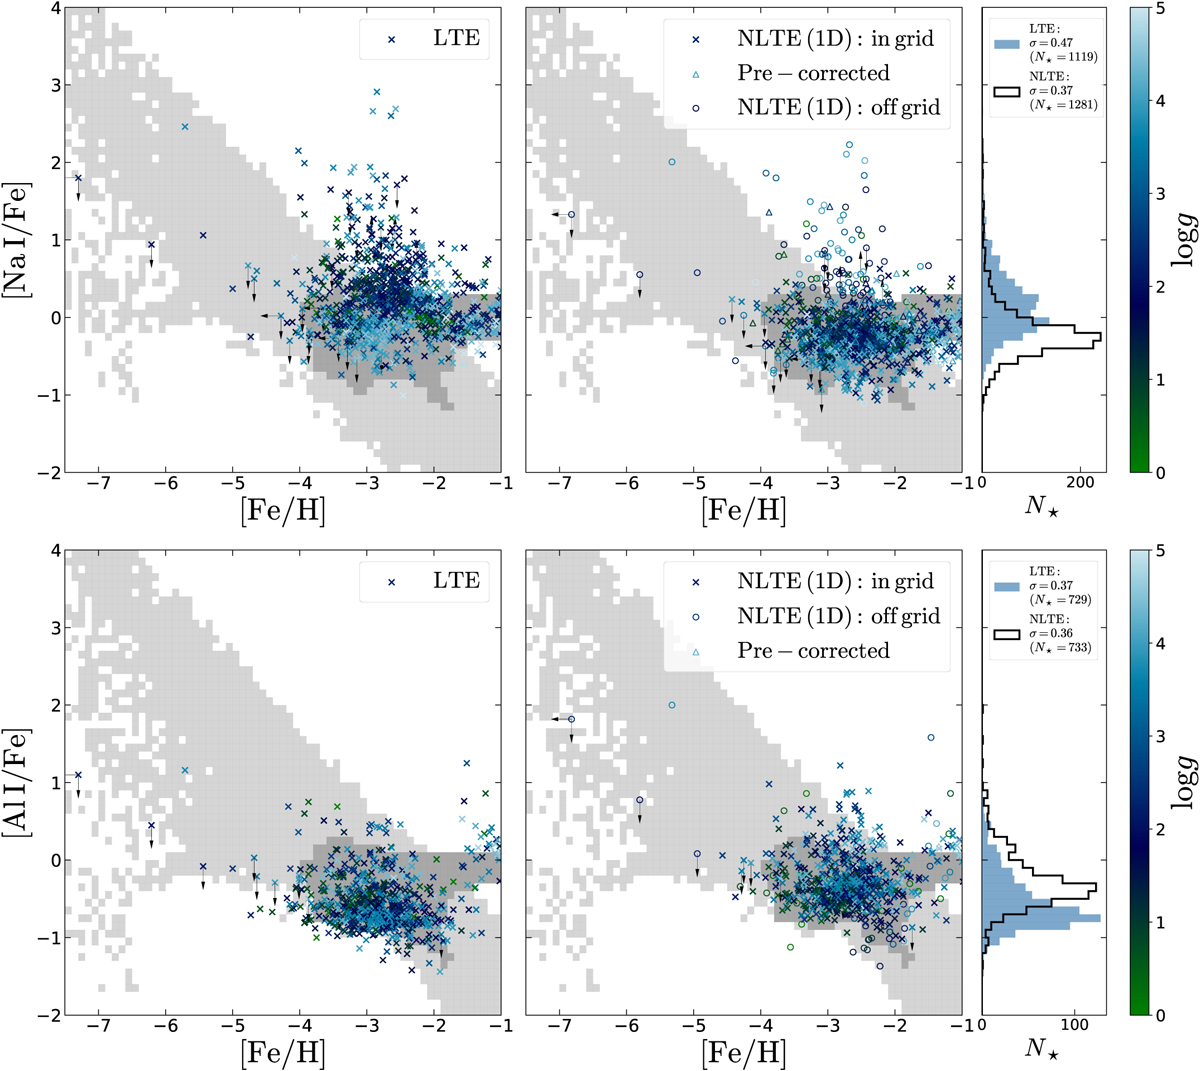
Distribution of MP Galactic halo stars in the [Na/Fe]–[Fe/H] (top) and [Al/Fe]–[Fe/H] (bottom) diagrams, as predicted by the NEFERTITI model: Pop III descendants (in light grey) and Pop I/II descendants (in dark grey). The data points represent all MP SAGA stars, colour-coded with log g, in LTE (left) and NLTE (right). Stars with parameters within the grids are marked with crosses (X), while circles indicate stars outside these limits. Triangles represent stars whose published abundances were already corrected for NLTE effects. The right marginal plots compare the SAGA [Na/Fe] and [Al/Fe] distributions in LTE (blue) and NLTE (black), excluding stars with upper or lower limits. The standard deviations of the distributions are noted at the top.
Current usage metrics show cumulative count of Article Views (full-text article views including HTML views, PDF and ePub downloads, according to the available data) and Abstracts Views on Vision4Press platform.
Data correspond to usage on the plateform after 2015. The current usage metrics is available 48-96 hours after online publication and is updated daily on week days.
Initial download of the metrics may take a while.