Fig. 16
Download original image
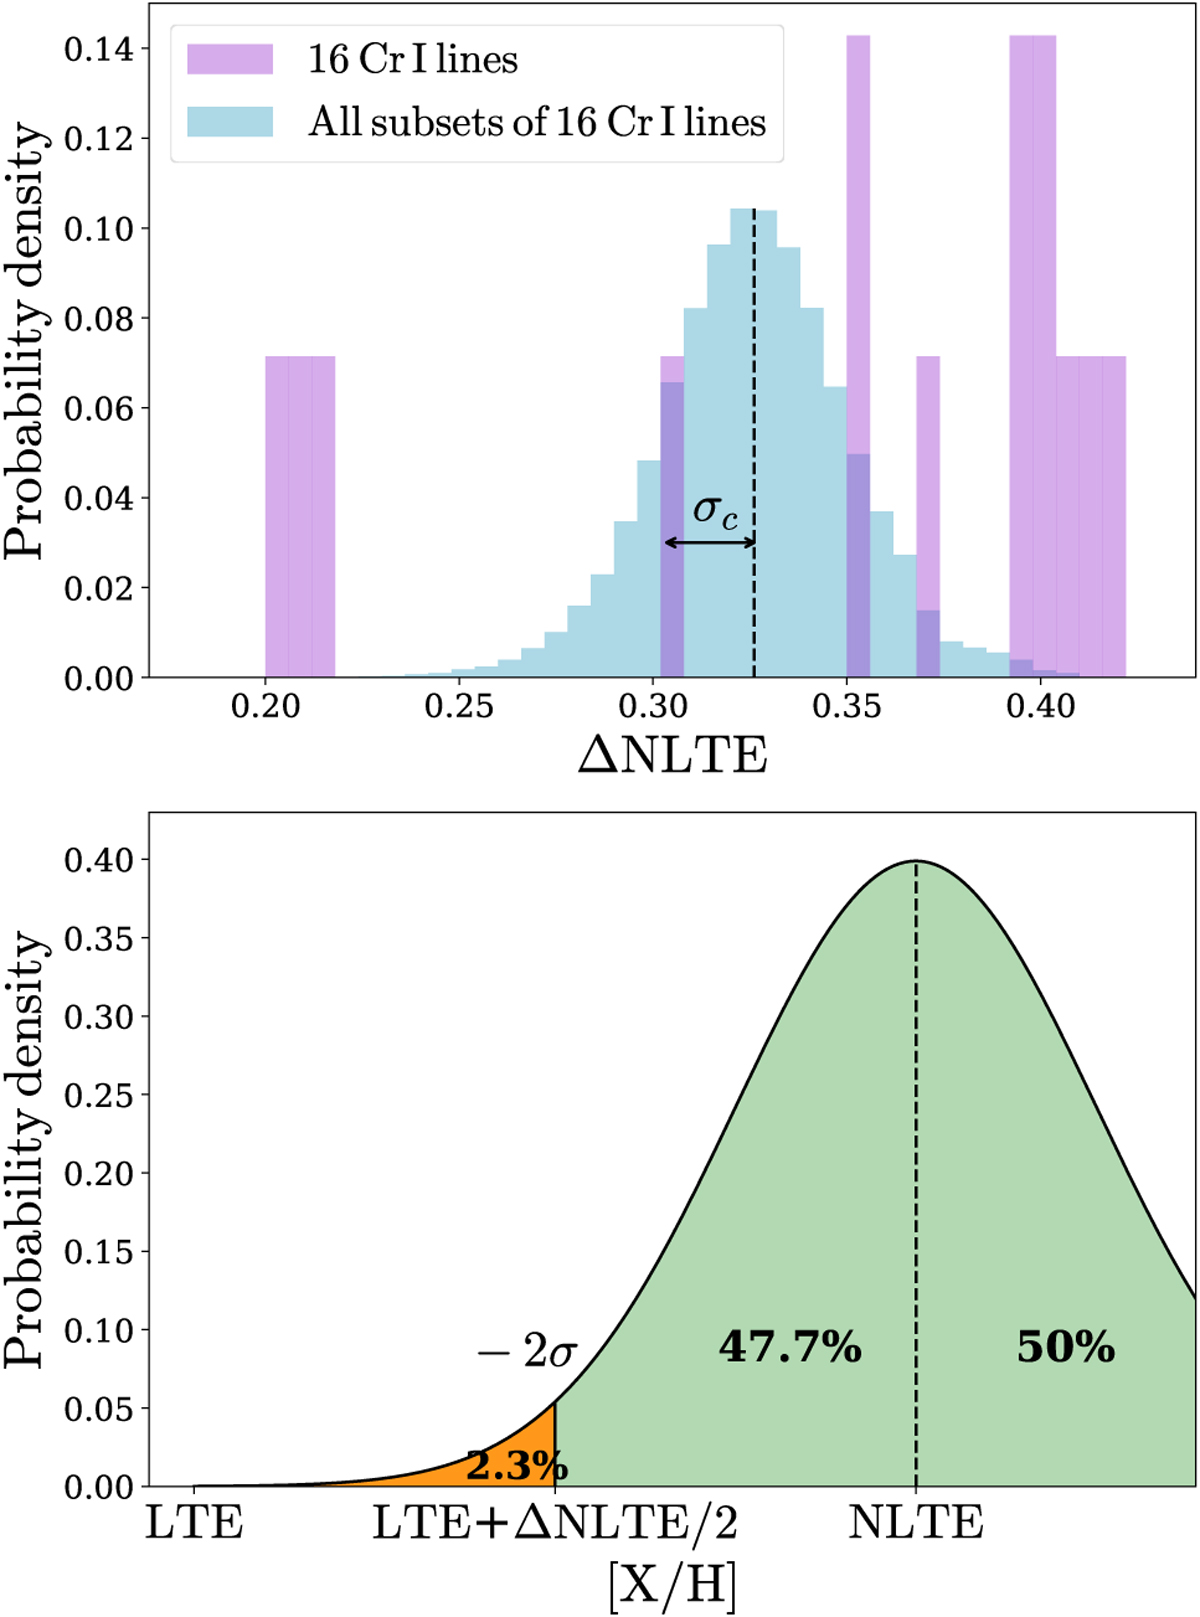
Top: normalized distribution of the NLTE corrections for 16 individual Cr I lines and the mean NLTE corrections of all their possible subsets. Bottom: Illustration of our criterion to assess the reliability of average NLTE corrections. If the line-by-line NLTE value falls within the risky area (orange), applying the average NLTE correction leads to a larger offset compared to adopting the LTE value. The percentages shown correspond to the case where 2σ = |ΔNLTE|/2.
Current usage metrics show cumulative count of Article Views (full-text article views including HTML views, PDF and ePub downloads, according to the available data) and Abstracts Views on Vision4Press platform.
Data correspond to usage on the plateform after 2015. The current usage metrics is available 48-96 hours after online publication and is updated daily on week days.
Initial download of the metrics may take a while.