| Issue |
A&A
Volume 699, July 2025
|
|
|---|---|---|
| Article Number | A33 | |
| Number of page(s) | 8 | |
| Section | Interstellar and circumstellar matter | |
| DOI | https://doi.org/10.1051/0004-6361/202554216 | |
| Published online | 27 June 2025 | |
A polarized view of the young pulsar wind nebula 3C 58 with IXPE
1
INAF – Osservatorio Astrofisico di Arcetri,
Largo Enrico Fermi 5,
50125
Firenze,
Italy.
2
Dipartimento di Fisica e Astronomia, Università degli Studi di Firenze,
Via Sansone 1,
50019
Sesto Fiorentino,
Italy
3
Istituto Nazionale di Fisica Nucleare, Sezione di Firenze,
Via Sansone 1,
50019
Sesto Fiorentino,
Italy
4
Department of Physics and Kavli Institute for Particle Astrophysics and Cosmology, Stanford University,
Stanford,
CA
94305,
USA
5
Guangxi Key Laboratory for Relativistic Astrophysics, School of Physical Science and Technology, Guangxi University,
Nanning
530004,
China
6
Department of Physics, The University of Hong Kong,
Pokfulam,
Hong Kong
7
Istituto Nazionale di Fisica Nucleare, Sezione di Pisa,
Largo B. Pontecorvo 3,
56127
Pisa,
Italy
8
Graduate Institute of Astronomy, National Central University,
300 Zhongda Road,
Zhongli, Taoyuan
32001,
Taiwan
9
Laboratory for Space Research, The University of Hong Kong,
Cyberport 4,
Hong Kong
10
Center for Astrophysics | Harvard & Smithsonian,
60 Garden Street,
Cambridge,
MA
02138,
USA
11
Key Laboratory of Particle Astrophysics, Institute of High Energy Physics, Chinese Academy of Sciences,
Beijing
100049,
China
12
University of Chinese Academy of Sciences, Chinese Academy of Sciences,
Beijing
100049,
China
13
INAF Osservatorio Astronomico di Cagliari,
Via della Scienza 5,
09047
Selargius
(CA),
Italy
14
Department of Physics and Astronomy, Louisiana State University,
Baton Rouge,
LA
70803,
USA
★ Corresponding author: This email address is being protected from spambots. You need JavaScript enabled to view it.
Received:
21
February
2025
Accepted:
7
May
2025
Abstract
Pulsar wind nebulae (PWNe) are among the most efficient particle accelerators in the Universe; however, the physical conditions and magnetic geometry in their inner regions remain poorly understood. X-ray polarization now provides a unique opportunity to investigate the magnetic field structure and turbulence properties close to the sites where high energy particles are accelerated. Here, we report on recent X-ray polarization measurements of the PWN 3C 58 by the International X-ray Polarimeter Explorer (IXPE). 3C 58 is a young system that displays a characteristic jet-torus structure that, unlike those in other PWNe, is observed almost edge-on. This nebula exhibits a high level of integrated polarization, approximately 22%, at an angle near 97°, with an implied magnetic field oriented parallel to the major axis of the inner torus. This suggests a toroidal magnetic geometry with little turbulence in the interior and an intrinsic level of polarization possibly approaching the theoretical limit for synchrotron emission. No significant detection of a polarized signal from the associated pulsar was found. These results confirm that the internal structure of young PWNe is far less turbulent than previously predicted and is at odds with multidimensional numerical simulations.
Key words: magnetic fields / polarization / radiation mechanisms: non-thermal / ISM: supernova remnants / X-rays: individuals: 3C 58
© The Authors 2025
 Open Access article, published by EDP Sciences, under the terms of the Creative Commons Attribution License (https://creativecommons.org/licenses/by/4.0), which permits unrestricted use, distribution, and reproduction in any medium, provided the original work is properly cited.
This article is published in open access under the Subscribe to Open model. This email address is being protected from spambots. You need JavaScript enabled to view it. to support open access publication.
1 Introduction
The pulsar wind nebula (PWN) 3C 58 (G130.7+3.1) is a young system that shares many similarities with other PWNe such as the Crab nebula, Vela, and MSH 15–52. It has been detected across the electromagnetic spectrum, from radio to X-rays and TeV γ-rays (Green et al. 1975; Becker et al. 1982; Davelaar et al. 1986; Torii et al. 2000; Bocchino et al. 2001; Slane et al. 2004, 2008; Fesen et al. 2008; Shibanov et al. 2008; Aleksić et al. 2014; Li et al. 2018; An 2019). Its apparent size is 10′ × 6.5′, similar in radio and X-ray, elongated in the east-west direction. At its commonly quoted distance of 3.2 kpc (Roberts et al. 1993), it has a size of ~9 × 6 pc; a more recent analysis estimates d ~ 2 kpc (Kothes 2013). This supernova remnant has traditionally been associated with SN 1181 (Stephenson & Green 2002). However, the expansion of the optical filaments surrounding the source (Bietenholz 2006; Fesen et al. 2008), casts doubt on this association (Chevalier 2005), and the 1181 event is now linked with the newly discovered remnant Pa 30 (Ritter et al. 2021; Schaefer 2023). The age of 3C 58 is therefore uncertain.
In the radio, the morphology of the nebula is complex, with many loops and filaments with a typical width of ~2 arcseconds and a luminosity contrast of ~2× (Reynolds & Aller 1988; Bietenholz 2006; Castelletti 2019). A prominent filament is found close to the pulsar, but unlike the Crab, this does not appear to mark the pulsar wind termination shock (Bietenholz 2006). The radio spectral index of −0.05 is quite uniform over the nebula (Bietenholz et al. 2001). The nonthermal radio nebula is embedded in a network of thermally emitting and radially expanding knots (Bocchino et al. 2001; Gotthelf et al. 2007; Fesen et al. 2008) that host an estimated total mass ~0.1 M⊙.
In X-rays, 3C 58 displays a central jet-torus structure (Slane et al. 2002), providing clear evidence of energy injection from its central pulsar, PSR J0205+6449. The torus has also been detected in the IR (Slane et al. 2008). An optical detection has been claimed (Shibanov et al. 2008); this is slightly fainter and softer than predicted from a simple extrapolation of the X-ray spectrum. The torus is oriented north-south, suggesting that the spin axis of the pulsar is aligned east-west and, unlike those of other PWNe, is viewed almost edge-on (within ±15°) (e.g. Ng & Romani 2004). The total nebula [2–8] keV luminosity is ~9 × 10⁻¹² erg s−1 cm−2 1; with about 20% originating from the torus. The spectrum softens with radius, with the photon index Γ increasing from ~2 to ~2.5 (An 2019). Spectral modeling of the source suggests a magnetic field in the range of 30–40 μG (Bucciantini et al. 2011; Torres et al. 2013; Lu et al. 2017; Kim et al. 2019). The body of the PWN shows an X-ray morphology characterized by filaments or loops that closely follow similar radio features.
Radio polarization maps (Wilson & Weiler 1976; Reich 2002; Sun et al. 2011; Castelletti 2019) show patchy polarization, with a typical coherence scale of about 10% of the nebula. The inferred magnetic-field orientation follows the filamentary structure, with a global tendency toward alignment with the nebula’s major axis. The average polarization degree (PD) in the radio is ~6–15%, with some regions reaching PDmax ≈ 30% and others showing negligible polarization. The central zone of the radio nebula, coincident with the X-ray torus shows radio PD up to a local maximum of ~10–13%, with an electric vector polarization angle (EVPA) in the east-west direction.
The pulsar PSR J0205+6449 has also been detected at radio, X-ray and GeV energies (Camilo et al. 2002; Murray et al. 2002; Livingstone et al. 2009; Kuiper et al. 2010; Abdo et al. 2009; Li et al. 2018) and there is a tentative optical counter-part (Shearer & Neustroev 2008; Moran et al. 2013). Its period, P = 65.68 ms, and period derivative, ![Mathematical equation: $\[\dot{P}=1.94 \times 10^{-13} \mathrm{~s} \mathrm{~s}^{-1}\]$](/articles/aa/full_html/2025/07/aa54216-25/aa54216-25-eq1.png) , correspond to a spin-down power
, correspond to a spin-down power ![Mathematical equation: $\[\dot{E} \sim 2.7 \times 10^{37} ~\mathrm{erg} \mathrm{s}^{-1}\]$](/articles/aa/full_html/2025/07/aa54216-25/aa54216-25-eq2.png) , a spin-down characteristic age τ ~ 5400 yr, and an effective surface dipole magnetic field Bs = 3.6 × 10¹² G. Its dispersion measure DM = 140.7 cm−3 pc corresponds to d ~ 2.8 kpc (Yao et al. 2017), consistent with the more recent distance estimate for the supernova remnant given above. The pulse profile in X-rays is characterized by a very narrow (FWHMϕ ~ 0.02) main peak that lags the radio pulse by δϕ ~ 0.09. There is evidence for a ~5× weaker, but ~2× broader, secondary X-ray peak lagging the primary by Δϕ ≈ 0.5. The peak flux ratio increases toward higher energies, with the secondary peak dominating above 1 GeV. The pulsed X-ray emission can be fitted by a single power law with a photon index of Γ ~ 1.0 and an integrated pulsed flux of f2–8 keV ~ 2.3 × 10⁻¹³ erg s−1 cm−2.
, a spin-down characteristic age τ ~ 5400 yr, and an effective surface dipole magnetic field Bs = 3.6 × 10¹² G. Its dispersion measure DM = 140.7 cm−3 pc corresponds to d ~ 2.8 kpc (Yao et al. 2017), consistent with the more recent distance estimate for the supernova remnant given above. The pulse profile in X-rays is characterized by a very narrow (FWHMϕ ~ 0.02) main peak that lags the radio pulse by δϕ ~ 0.09. There is evidence for a ~5× weaker, but ~2× broader, secondary X-ray peak lagging the primary by Δϕ ≈ 0.5. The peak flux ratio increases toward higher energies, with the secondary peak dominating above 1 GeV. The pulsed X-ray emission can be fitted by a single power law with a photon index of Γ ~ 1.0 and an integrated pulsed flux of f2–8 keV ~ 2.3 × 10⁻¹³ erg s−1 cm−2.
Sect. 2 presents the polarization observations, both X-ray and radio, used in this work. An analysis of the unusually strong X-ray polarization background is given in Sect. 3. Sect. 4 reports our findings for the pulsar and PWN polarization, and in Sect. 5 we present our conclusions.
2 Observations
The Imaging X-ray Polarimetry Explorer (IXPE) was launched on December 9, 2021 (Weisskopf et al. 2022). As the first mission solely dedicated to imaging X-ray polarization, IXPE is a collaborative effort between NASA and the Italian Space Agency (ASI). The observatory comprises three identical telescopes, each equipped with a polarization-sensitive gas pixel detector (GPD) positioned at its focal plane. These GPDs are housed within a detector unit (DU).
The source 3C 58 was observed by IXPE twice in the summer of 2024. The first segment began on July 9, 2024, at 21:54:30 UTC and ended on July 14, 2024, at 14:53:13 UTC. The second segment started on July 29, 2024, at 04:13:54 UTC and continued until August 10, 2024, at 04:42:04 UTC. These segments were then combined to create a single data set with approximately 966 ks LIVETIME. IXPE Level-2 data are publicly available for download from the HEASARC archive2 (ObsID 03002099). Due to the high level of solar activity during both segments, data were reprocessed with a nonstandard approach to reduce contamination by flares (see Sect. 3). The arrival times of the remaining events were corrected to the solar system barycenter using the HEASOFT BARYCORR tool and the JPL 421 ephemeris. The absolute sky coordinates were bore-sighted by adjusting the FITS WCS keywords in order to align the IXPE brightness peak with the intensity peak of Chandra images.
We also analyzed a 2.69-hour 2017 3C 58 JVLA radio observation in the S (νc = 3 GHz, Δν = 2 GHz, i.e., λ ≈ 6 cm) and C (νc = 6 GHz, Δν = 4 i.e., λ ≈ 3 cm) bands. The S-band data included configurations C and D, and the C-band data included configuration C. The data were taken in continuum mode with all four Stokes parameters. Combining all data, the minimum baseline was 35 m, so that the 6 and 3 cm observations are sensitive to angular scales of up to 490″ and 240″, respectively. J0137+3309 was observed for bandpass, polarization angle, and flux density calibrations; J0217+7333 was observed as a calibrator for the visibility phases; J0319+4130 was observed to monitor polarization leakage.
All JVLA data analysis used the Common Astronomical Software Application (CASA) package (CASA Team 2022)3. We first applied the JVLA CASA Calibration pipeline (6.6.1–17) to remove radio frequency interference (RFI), perform basic flux, bandpass, gain, and polarization calibrations, and determine the delay. We solved for the multiband cross-hand delays of the two basebands separately. We then calculated the polarization leakage terms and the R–L polarization angle. Additional RFI flagging was performed after pipeline processing. Following the flagging and calibration process, we formed Stokes I, Q, and U images, deconvolved using the task tclean. To compromise between sensitivity and resolution, we used the Briggs weighting algorithm with robust = 0.5 for these two-band images. After the initial round of cleaning, we interactively applied a clean mask to restrict the cleaned area in subsequent iterations. The synthesized beams in the final map were 8.3″ × 6.3″ in S-band and 3.49″ × 3.01″ in C-band. The root mean square noise levels in the Stokes I images are 83 μJy beam−1 (S) and 72 μJy beam−1 (C). The noise levels in Stokes Q and U were 80 μJy and 50 μJy, respectively, similar to the theoretical rms.
The rotation measure (RM) of these two bands was obtained by splitting the data into four sub-band images, then using the task RMFIT to determine the RM map. We corrected the Q and U Stokes maps to infinite frequency using this RM map.
3 Background
The 3C 58 observation period was characterized by unusually strong solar flaring activity. X-rays from solar flares can contribute a polarized signal to the background. Initial evidence for possible solar flare contamination was observed in the background count rate in Detector Unit 2 (DU2), which was found to be 20% higher than in Detector Unit 1 (DU1). The latter was partly shielded from the Sun during this observation.
For background event rejection, we adopted a strategy based on the approach introduced by Di Marco et al. (2023). However, for additional background suppression, we modified their highly conservative rejection criteria to a more aggressive approach, tuned specifically for 3C 58:
![Mathematical equation: $\[0.004 E+0.88\left[1-e^{-(E+0.25) / 1.1)}\right]+0.01<E V T_{-} F R A<1\]$](/articles/aa/full_html/2025/07/aa54216-25/aa54216-25-eq3.png) (1)
(1)
![Mathematical equation: $\[N U M \_P I X<115+195 \times(E / 8)^2,\]$](/articles/aa/full_html/2025/07/aa54216-25/aa54216-25-eq4.png) (2)
(2)
where E is the energy of the event in keV, and EVT_FRA and NUM_PIX are parameters characterizing the track in Level-1 files. This allowed us to remove ~10% more events than by applying standard cuts.
By comparing the count spectrum in a region of 50 arcsec radius centered on the pulsar position with that from a background region of the same size, we found that above ~7 keV, the background dominates (Fig. 1). Thus, we decided to limit further analysis to the [2–6] keV energy range.
To assess residual contamination by flaring activity, we performed a polarization analysis of the background. We selected all events in the field of view (FoV) at distances greater than 120″ from the pulsar and used the ixpeobssim (31.0.2) PCUBE algorithm to measure the background polarization. By simulating this system with the ixpeobssim package and archival Chandra images, we verified that the PWN contributes less than 2% of the total events beyond 120″ from the pulsar. Combining the three DUs, we found that this background was significantly polarized, with a polarization degree (PD) of 11.1% ± 1.3% at a polarization angle of −11.0° ± 3.3°. However, the signal varied greatly between the DUs, a clear indication of solar contamination (see Table 1). Similar results, though at lower statistical significance, were obtained for smaller background regions farther from the detector edges, so this is not a vignetting effect.
To confirm that the signal was source-independent, we used the IXPE’s Science Operation Center reconstruction pipeline4 and the STATUS2 flags to select data from occultation periods when no calibration source was being exposed, yielding a Level-2 format dataset that could be used as a pure background sample. During these background windows, flaring activity was especially strong, leading to a higher degree of polarization (Silvestri, private communication). The same analysis performed on other archival sources revealed that significant modulation of the background is often recovered during solar flaring activity, both in and out of occultation, with similar polarization position angles.
Thus, standard background rejection was insufficient, even with our more aggressive cuts. For this reason, we deflared our observations by removing all time intervals when the count rate of the background was 2.5 times higher than the median rate. This excised all events recorded during class M solar flares, as measured by the Geostationary Operational Environmental Satellites (GOES) (Hanser & Sellers 1996)5. The excised time amounted to about 5% of the total observation. We repeated the analysis on this deflared dataset and found a polarization degree of 6.8% ± 1.4% and a polarization angle of −6.1° ± 5.9°, still highly significant. However, lowering the flare excision threshold to twice the median rate did not substantially decrease the background polarization (PD= 5.9% ± 1.4%). This indicates that flare contamination was caused by continuous low-level activity covering the entire first segment of the observation. Unfortunately, this activity was too steady for count rate cuts to allow effective excision.
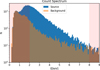 |
Fig. 1 Comparison of the count spectrum in a 50 arcsec radius centered on the source versus an equal size background region, for background-rejected data before de-flaring. Red shaded regions highlight counts outside the fiducial [2–8] keV energy range for IXPE calibration. |
Background polarization properties of 3C 58.
4 Analysis
4.1 Imaging and polarization
Figure 2 shows the total count map of the target region after background rejection and deflaring. In comparison with Chandra images, it is evident that IXPE cannot resolve either the inner jet-torus structure or any of the PWN filamentary or loop structures. However, the large-scale PWN morphology is well-captured. In particular, the maximum likelihood expectation map (Ehlert et al. 2022) for the source emission clearly shows that large-scale features are present. However, the counts in the outer regions of the nebula are too low to allow a detailed morphological study of polarization, especially since bright unresolved sources, such as the PWN core, can produce spurious polarized halos due to “polarization leakage” (Bucciantini et al. 2023a). We also note that the source covers a large fraction of the FoV, with the outer edge of the eastern lobe affected by vignetting.
Figure 3 shows the radio polarization map of 3 C 58 in the JVLA 2–4 GHz S-band and 4–8 GHz C-band. The radio polarization structure is similar at both frequencies, and the magnetic field follows the structure of the radio loops in the body of the nebula. Notably, the radio polarization does not show the central torus or jet. The polarization degree in the central region corresponding to those bright X-ray features is ≈10%, with a polarization angle of ~95°, aligned with the east-west main axis of the PWN. This is consistent with a toroidal magnetic field in the central region. Regions of higher polarization, up to ~30%, are found only at the edges of the PWN.
The Chandra map shows that the X-ray emission of 3C 58 is dominated by the central torus region, whose extent is much smaller than the IXPE resolution (~30″ half power diameter). To evaluate the possible spatial dependence of the X-ray polarization in 3C 58 and its compatibility with a point-like source, we performed a polarization analysis using the PCUBE algorithm of ixpeobssim over circular regions centered on the pulsar position, with radii varying from 15 to 60 arcsec. The background-subtracted polarization degree (PD) was found to have a decreasing trend with aperture size, from 27% at 15 arcsec to 16% at 60 arcsec, with a significance ranging from 4.0σ to 5.3σ (the maximum is achieved for a region of 40 arcsec radius), while the polarization angle (PA) is always ~100°. Results are reported in Table 2 for a circular region of 40 arcsec radius centered on the pulsar, and in Fig. 4 as a function of the region size.
We repeated the analysis by running a spectro-polarimetric fit with both 3ML (Vianello et al. 2015) and XSPEC, using an independent background selection. Both tools implement a forward-folding technique, which allows fitting of the Stokes I, Q and U spectra, and retrieval of the best-fit spectral and polarimetric models.
We performed the spectro-polarimetric XSPEC analysis using the HEASoft software package (version 6.34)6. The source region (r < 40 arcsec from the pulsar) and background (a circular region of 120 arcsec radius centered at RA=2:05:36, Dec=64:53:31) were filtered with the FTOOLS command xselect, setting the parameter Stokes = NEFF to extract the weighted Stokes I, Q, and U spectra for all three detector units. Response files for the I, Q, and U spectra were generated using the IXPE-specific command ixpecalcarf, which utilized the cleaned Level-2 event lists for each DU and the corresponding attitude files from housekeeping data. We performed data fitting using XSPEC (version 12.14.1)7. The backgroundsubtracted Stokes I, Q, and U spectra were simultaneously fitted across all three DUs using a model comprising absorption (the tbabs by Wilms et al. (2000)), a power law (powerlaw), and constant polarization degree and angle (polconst). To account for flux calibration differences between DUs, we included a cross-normalization constant (const) in the model. For line-of-sight absorption towards the source, we fixed the hydrogen column density, NH, at 0.42 × 1022 cm−2 (Picquenot et al. 2024). Within our assumed [2–6] keV range, an absorbed power law with a photon index of 2.25 ± 0.03 adequately describes the spectrum. The unabsorbed flux extrapolated in the 2–8 keV range is estimated to be approximately (2.82 ± 0.05) × 10−12 erg cm−2 s−1 at 1σ confidence level. The polarization degree is 21.4% ± 3.5%, while the polarization angle is 98.1° ± 4.8°. A summary of the best-fit parameters is provided in Table 2.
For the 3ML analysis, we created Stokes spectral files for the source region (r < 40″ from the pulsar) and the background region (120 < r < 300″ from the pulsar) using the PHA1, PHA1Q and PHA1U algorithms of ixpeobssim with an unweighted binning scheme. For the response files, we used the on-axis response (version 13, validity date 20240701) provided in the CALDB folder of ixpeobssim. As in the XSPEC analysis, the spectral model was an absorbed power law, with absorption given by the PhAbs model and NH = 0.42 × 1022 cm−2. The polarization degree and angle of the source were modeled as constant in the [2–6] keV keV energy range. A multiplicative normalization was included to cross-calibrate between the different DUs. The resulting best-fit photon index was found to be 2.31 ± 0.03, with a polarization of 22% ± 4% at an angle of 98° ± 5°, in good agreement with the previous analysis. These polarization results are summarized in Table 2.
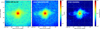 |
Fig. 2 Left panel: IXPE total count map in the full 2–8 keV band after background rejection and deflaring. Central panel: maximum likelihood expectation value of the source IXPE counts in the 2–8 keV range, using the method of Ehlert et al. (2022). Right panel: Chandra count flux in the in the 2–8 keV band derived from ObsIDs 728, 3832, 4382, 4383, 25786, 25787, 25788, 25789, 25790, and 26402. |
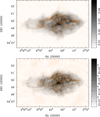 |
Fig. 3 Top panel: VLA S-band polarization map of 3C 58, with magnetic field direction overlaid on the total intensity map (Jy per beam). Bottom panel: same as top panel, but for the C-band. |
Background-subtracted polarization properties of 3C 58.
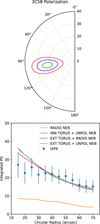 |
Fig. 4 Top panel: Polarization angle and degree in a region of 40 arcsec radius centered on the pulsar in the [2–6] keV energy range. Contours represent the 1,2, and 3σ confidence regions. Bottom panel: Polarization degree as a function of the region size for regions centered on the pulsar. Points show IXPE values with their 1σ uncertainty. Solid lines represent the expectations for various models: a polarized inner torus (PD=75%) embedded into an unpolarized external nebula (green); a polarized extended torus (PD=55%) embedded into an unpolarized external nebula (purple); a polarized extended torus (PD=50%) embedded into an external nebula with the same polarization as seen in radio (red); and a nebula having the same polarization as seen in radio (orange). |
4.2 Timing
For a phase analysis, we required a current pulsar ephemeris. Because the ephemeris of the Australia Telescope National Facility (ATNF) catalog8 is 17 years old, we measured the ephemeris for the current observation from Fermi-LAT γ-ray data. Since 3C 58 is bright in the gamma-ray band, we used the 100 MeV–100 GeV LAT data with a 1-degree region of interest to measure the pulsations. Times of arrival were accumulated in 10-day exposure intervals, and we performed a phase-coherent timing analysis using Tempo2 (Hobbs et al. 2006), which provided an up-to-date ephemeris, reported in Table 3. The ephemeris used in this paper covers the time range from MJD 60420 to 60550 (corresponding to April 20, 2024–August 28, 2024). No evidence for any glitch was found during this period. Figure 5 shows the phase-folded pulse profile IXPE pulse profile in the [2–6] keV keV energy band over a region of 40 arcsec radius centered on the pulsar, together with the analytical model of Kuiper et al. (2010). The main peak is clearly evident, although the second peak is not well detected. To assess possible pulsar polarization, we performed a phase-resolved polarization analysis by dividing the period into 20 equally spaced phase bins and applying the PCUBE method of ixpeobssim to each bin. In all phase bins, the PD is below the M D P99 and is consistent within ~1σ with the PD value inferred for the PWN. No significant increase or decrease in PD is seen in correspondence with the main peak. A PD value higher than the M D P99 is found only in one bin just ahead of the second pulse. However, after accounting for counting statistics, the probability of having one out of 20 bins above M D P99 is ~18%. Indeed, such a high-polarization bin disappears if a slightly different binning is used. We also attempted to measure the polarization properties in phase bins matching both the main and second peaks but found no significant difference with respect to the off-pulse values, in terms of polarization degree and angle.
Pulsar ephemeris.
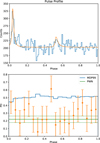 |
Fig. 5 Top panel: IXPE pulse profile for the PSR J0205+6449/3C 58 system, in the [2–6] keV band, within a region of 40 arcsec radius from the pulsar, compared to the analytical model by Kuiper et al. (2010). Bottom panel: phase-resolved polarization degree within the same region, together with the minimum detectable polarization at 99% confidence level. |
4.3 A search for finer polarization structure
With the pulse ephemeris above, we searched for finer polarization effects, using the “simultaneous fitting” procedure described by Wong et al. (2023). Unlike the simple on-off method, the method utilizes externally (Chandra)-constrained models of the pulsar and PWN fluxes to help simultaneously solve for their polarization. These models are generated using a high spatial-resolution Chandra-derived template for the nebular flux and the pulsar phase-varying X-ray spectrum. The models are convolved with the IXPE instrument response to build the predicted Stokes I map for each component in various pulsar phase bins. The flux models and IXPE polarization data are binned in phase, energy, and spatial coordinates, resulting in an overdetermined linear set of equations. The unknown parameters are the polarization of the pulsar, which only varies with phase, and the nebula, which only varies spatially. These equations can be solved analytically via least-squares regression. For this analysis, we compiled 10 Chandra archival observations (ObsIDs 728, 2604, 3832, 4382, 4383, 25786, 25787, 25788, 25789, and 25790) with aggregate ~500 ks exposure (see Fig. 2 for the merged Chandra image). We replaced the pulsar-dominated peak (r = 0.5″, 2×FWHM) with a subsampling of nebular events in a 1–1.5″ annulus to construct a high-resolution nebula model. The pulsar light curve was obtained using the analytic model of Kuiper et al. (2010) (their Eqs. (2) and (3) and Table 3), and the spectra of the two pulses were described using the PCA measurements reported in Table 4, with the normalization converted to the nominal IXPE 2–8 keV energy range. We designated any flux below 1% of the maximum flux of each pulse as belonging to a constant off-pulse component, with photon index Γ = 2.42 as described by Kim & An (2021) (see Table 2). These fluxes were convolved with the IXPE effective area and the on-axis PSFs derived by Dinsmore & Romani (2024) in ixpeobssim to obtain the predicted IXPE counts for each component.
Several correction factors were needed to match the simulated and observed light curves and off-pulse images. First, we rescaled the nebular component by a factor of 0.8× to match the DC levels of the total light curve. Then, we scaled the pulsar component by 0.68× to match the main pulse peak height to the observations. These reductions may be attributed to the ~2′-off axis position of the pulsar during the observation, as well as an overestimate of the broadband pulse flux in the dominant ~keV range by Kuiper et al. (2010) (see their Fig. 7). After matching the light curves, we inspected the off-pulse maps, finding that the central pixels in the simulation were systematically too bright. We addressed this by applying additional blurring applied to our (on-axis) model PSFs. The best χ2 match between the simulated and data images was obtained using a σ = 12″ Gaussian blur.
We divided the data into three phase bins representing the main pulse, interpulse, and off-pulse, modeled a single 2–8 keV energy bin, and computed a 5 × 5 spatial grid of 15″ pixels. The binning scheme was chosen to minimize the number of low-count bins (~12% of these bins had fewer than ten counts) while adequately resolving the PSF and phase structure. Polarization leakage correction was applied using the method described by Dinsmore & Romani (2024). We obtained Q/I = −0.20 ± 0.57 and U/I = 0.83 ± 0.57 for the pulsar main pulse, and Q/I = 0.21 ± 1.73 and U/I = −0.41 ± 1.73 for the pulsar interpulse. Figure 6 shows the nebula polarization vectors (rotated by 90° to show magnetic field direction) overlaid on the Chandra image. Unfortunately, there were too few counts to allow full resolution of the inner nebula, and the pulsar did not produce significant polarization in either pulse-phase bin. However, the lower-significance magnetization vectors in the inner ~30″ do follow the expected north-south orientation of a central torus. The most significant pixels show some PA variation, which may hint at more complex fields associated with the apparent jet and X-ray filamentary structure. This analysis is consistent with the coarser spatial regions explored above: integrating all 15″ pixels, we obtain PD= 18% ± 3.3% and a E V P A = 99° ± 5°, consistent with the XSPEC and 3ML measurements.
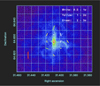 |
Fig. 6 A five-by-five array of 15″ pixels showing the nebula’s magnetic field, rotated 90° from the EVPA, as measured using simultaneous fitting. White bars denote 0.5–1σ significance, yellow bars 1–2σ, and green bars 2–3σ. The pixel field is oriented north-south, as expected for a toroidal magnetic field in the inner nebula. Other pixels show some EVPA variation, possibly following the filamentary structures of the background Chandra image. A flux cut of >700 counts removes spurious polarization vectors in the outskirts. The red bar represents PD=100%. |
4.4 Polarization modeling
The top panel of Fig. 4 shows the highly significant polarization of the central region. In the lower panel, the points represent the polarization degree computed for pulsar-centered circular regions of varying aperture, showing a decreasing trend in PD with region size. By performing a sample of mock simulations of a uniformly polarized PWN, we determined that the observed trend is incompatible with a uniformly polarized PWN at about the confidence level 1–1.5σ. To check compatibility with radio polarization maps, we performed an ixpeobssim simulation of this source, applying the radio polarization map of Sect. 4.1 to the X-ray image defined by the Chandra events. Repeating the multi-radius aperture extraction, we observe in the simulated data (orange curve) a trend of decreasing polarization from PD≃8% to ≃4%, with PA ≃ 90°. Although much lower than the X-ray PD, the similar decrease in the radio suggests a common origin. To probe its nature, we consider four possible scenarios: (A) a uniformly polarized inner torus (the region within 2.5 arcsec from the pulsar) embedded in an unpolarized nebula; (B) a uniformly polarized inner torus embedded in a nebula with the radio polarization imposed; (C) a uniformly polarized extended torus (an elliptical region with 10” major axis) embedded in an unpolarized nebula; (D) a uniformly polarized extended torus embedded in a nebula with the radio polarization structure. Figure 7 illustrates the region locations. We have ignored the (unpolarized) thermal X-ray emission, which, while ~20% of the total PWN emission in the [2–6] keV energy range (Picquenot et al. 2024), is much less centrally peaked than the nonthermal component, with an estimated contribution <5% in the central 40″ region.
Figure 7 shows the two “torus” regions in the Chandra image. The inner torus contains about 10% of the total PWN counts and about 25% of the counts within a region of 40 arcsec radius. The pulsar contribution to the emission within this same region is found, both by imaging and timing, to be approximately ≈10% and is neglected in this analysis. The extended torus contains about 15% of the total PWN counts and about 40% of the counts within a region of 40 arcsec radius. Both cases A and B require an inner torus with an intrinsic PD ≈75% ± 5% to match the high polarization found by IXPE. This is at the very limit of the theoretical maximum for synchrotron radiation (≈70%), since some projection depolarization is expected even for a near edge-on viewing angle. Given the weak (radio-matching) nebular polarization assumed here, the results are quite insensitive to the extended emission. The larger case C/D torus requires a more modest, but still large, PD ≈55% ± 5% and PD ≈50% ± 5%, respectively. This PD level is similar to that previously found in other spatially resolved PWNe, such as Crab (Bucciantini et al. 2023b; Wong et al. 2024), Vela (Xie et al. 2022), and MSH 15-52 (Romani et al. 2023), supporting the idea that a larger region contributes to central polarization. All models exhibit a steeper fall-off than the data. This could be explained if the extended nebula PD is a factor of 2–3 higher than the radio-set values applied here. Some of the difference might also be attributed to the imperfectly calibrated IXPE response at this substantial off-axis angle.
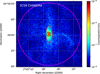 |
Fig. 7 Chandra count flux in the [2–8] keV band of the inner PWN (same as Fig. 2). The outer magenta circle marks the 40 arcsec radius region used in the current analysis. The inner black circle marks the region of the inner torus. The red ellipse marks the region of the extended torus. |
5 Conclusions
With the observation of 3C58, IXPE has now covered nearly all young, extended PWNe. Together with previous targets, these new data confirm a general trend suggesting a high level of polarization in the inner regions of these nebulae, much higher than expected from either naive extrapolation of existing long-wavelength data or from numerical simulations. For 3C 58, we verified that, under any reasonable assumption for the size of the polarized central region-whether compact or extended-the inferred level of polarization implies a highly ordered magnetic field. This contrasts with recent PWN modeling that suggests a major role for turbulence in the acceleration region close to the pulsar termination shock (Zhdankin et al. 2017; Bresci et al. 2023). However, we emphasize that polarization is not a direct measure of magnetic field organization but ultimately a measure of turbulence isotropy. Thus, we cannot rule out the presence of strongly anisotropic turbulence, an issue that requires further investigation both in terms of possible observable consequences and theoretical implications. Unfortunately, with 3C 58 being relatively faint, our ability to resolve fine structure in this PWN with IXPE is limited and we cannot assess the possible patchiness of the PD. Similarly, with IXPE’s modest spatial resolution, the pulsed signal was not well separated from the surrounding nebula, and we can only derive weak upper limits on its polarization. With its modest [2–6] keV flux, the pulsed signal does not significantly perturb the nebular analysis at our present sensitivity. While the integrated PD is very close to that of the Crab, our modeling suggests that the inner regions potentially have a much higher PD and, in this respect, be closer to what is seen in Vela. If the age of 3C 58 is older than that derived from its traditionally claimed association with SN 1181, and closer to the characteristic age of PSR J0205+6449, this might imply a possible relation between turbulence in PWNe and their age, likely linked to the possible development of Rayleigh–Taylor instability, which is known to be stronger in the earlier phases.
An important aspect of the current analysis is the high level of polarized background found during a period of moderate solar activity, and the difficulty encountered in filtering out this contribution. We showed that standard background rejection tools based on track properties do not adequately suppress this background and that even removal of flaring epochs flagged by background rate increases does not completely remove this polarized flux. This challenges the naive assumption that the background can always be treated (and subtracted) as an unpolarized contribution. Thus, background polarization should be account for, especially when analyzing faint and extended sources during periods of high solar activity.
Acknowledgements
The Imaging X-ray Polarimetry Explorer (IXPE) is a joint US and Italian mission. The US contribution is supported by the National Aeronautics and Space Administration (NASA) and led and managed by its Marshall Space Flight Center (MSFC), with industry partner Ball Aerospace (contract NNM15AA18C). This research was supported in part by grant 80NSSC25K7096. The Italian contribution is supported by the Italian Space Agency (Agenzia Spaziale Italiana, ASI) through contract ASI-OHBI-2022-13-I.0, agreements ASI-INAF-2022-19-HH.0 and ASI-INFN-2017.13-H0, and its Space Science Data Center (SSDC) with agreements ASI-INAF-2022-14-HH. 0 and ASI-INFN 2021-43-HH.0, and by the Istituto Nazionale di Astrofisica (INAF) and the Istituto Nazionale di Fisica Nucleare (INFN) in Italy. This research used data products provided by the IXPE Team (MSFC, SSDC, INAF, and INFN) and distributed with additional software tools by the High-Energy Astrophysics Science Archive Research Center (HEASARC), at NASA Goddard Space Flight Center (GSFC). N.B. was supported by the INAF MiniGrant “PWNnumpol – Numerical Studies of Pulsar Wind Nebulae in The Light of IXPE.” F.X. is supported by National Natural Science Foundation of China (grant No. 12373041 and No. 12422306), and Bagui Scholars Program (XF). C.-Y.N. and S. Zhang are supported by a GRF grant of the Hong Kong Government under HKU 17304524.
References
- Abdo, A. A., Ackermann, M., Ajello, M., et al. 2009, ApJ, 699, L102 [CrossRef] [Google Scholar]
- Aleksić, J., Ansoldi, S., Antonelli, L. A., et al. 2014, A&A, 567, L8 [NASA ADS] [CrossRef] [EDP Sciences] [Google Scholar]
- An, H. 2019, ApJ, 876, 150 [NASA ADS] [CrossRef] [Google Scholar]
- Becker, R. H., Helfand, D. J., & Szymkowiak, A. E. 1982, ApJ, 255, 557 [Google Scholar]
- Bietenholz, M. F. 2006, ApJ, 645, 1180 [CrossRef] [Google Scholar]
- Bietenholz, M. F., Kassim, N. E., & Weiler, K. W. 2001, ApJ, 560, 772 [Google Scholar]
- Bocchino, F., Warwick, R. S., Marty, P., et al. 2001, A&A, 369, 1078 [NASA ADS] [CrossRef] [EDP Sciences] [Google Scholar]
- Bresci, V., Lemoine, M., & Gremillet, L. 2023, Phys. Rev. Res., 5, 023194 [Google Scholar]
- Bucciantini, N., Arons, J., & Amato, E. 2011, MNRAS, 410, 381 [NASA ADS] [CrossRef] [Google Scholar]
- Bucciantini, N., Di Lalla, N., Romani, R. W. R., et al. 2023a, A&A, 672, A66 [NASA ADS] [CrossRef] [EDP Sciences] [Google Scholar]
- Bucciantini, N., Ferrazzoli, R., Bachetti, M., et al. 2023b, Nat. Astron., 7, 602 [Google Scholar]
- Camilo, F., Stairs, I. H., Lorimer, D. R., et al. 2002, ApJ, 571, L41 [NASA ADS] [CrossRef] [Google Scholar]
- CASA Team (Bean, B., et al.) 2022, PASP, 134, 114501 [NASA ADS] [CrossRef] [Google Scholar]
- Castelletti, G. 2019, in Supernova Remnants: An Odyssey in Space after Stellar Death II, 161 [Google Scholar]
- Chevalier, R. A. 2005, ApJ, 619, 839 [CrossRef] [Google Scholar]
- Davelaar, J., Smith, A., & Becker, R. H. 1986, ApJ, 300, L59 [Google Scholar]
- Di Marco, A., Soffitta, P., Costa, E., et al. 2023, AJ, 165, 143 [CrossRef] [Google Scholar]
- Dinsmore, J. T., & Romani, R. W. 2024, ApJ, 962, 183 [NASA ADS] [CrossRef] [Google Scholar]
- Ehlert, S., Chen, C. T., Swartz, D., et al. 2022, MNRAS, 515, 5185 [Google Scholar]
- Fesen, R., Rudie, G., Hurford, A., & Soto, A. 2008, ApJS, 174, 379 [Google Scholar]
- Gotthelf, E. V., Helfand, D. J., & Newburgh, L. 2007, ApJ, 654, 267 [NASA ADS] [CrossRef] [Google Scholar]
- Green, A. J., Baker, J. R., & Landecker, T. L. 1975, A&A, 44, 187 [NASA ADS] [Google Scholar]
- Hanser, F. A., & Sellers, F. B. 1996, SPIE Conf. Ser., 2812, 344 [NASA ADS] [Google Scholar]
- Hobbs, G. B., Edwards, R. T., & Manchester, R. N. 2006, MNRAS, 369, 655 [Google Scholar]
- Kim, M., & An, H. 2021, J. Korean Astron. Soc., 54, 1 [Google Scholar]
- Kim, S., Park, J., & An, H. 2019, J. Korean Astron. Soc., 52, 173 [Google Scholar]
- Kothes, R. 2013, A&A, 560, A18 [NASA ADS] [CrossRef] [EDP Sciences] [Google Scholar]
- Kuiper, L., Hermsen, W., Urama, J. O., et al. 2010, A&A, 515, A34 [NASA ADS] [CrossRef] [EDP Sciences] [Google Scholar]
- Li, J., Torres, D. F., Lin, T. T., et al. 2018, ApJ, 858, 84 [NASA ADS] [CrossRef] [Google Scholar]
- Livingstone, M. A., Ransom, S. M., Camilo, F., et al. 2009, ApJ, 706, 1163 [Google Scholar]
- Lu, F.-W., Gao, Q.-G., Zhu, B.-T., & Zhang, L. 2017, MNRAS, 472, 2926 [NASA ADS] [CrossRef] [Google Scholar]
- Moran, P., Mignani, R. P., Collins, S., et al. 2013, MNRAS, 436, 401 [Google Scholar]
- Murray, S. S., Slane, P. O., Seward, F. D., Ransom, S. M., & Gaensler, B. M. 2002, ApJ, 568, 226 [CrossRef] [Google Scholar]
- Ng, C.-Y., & Romani, R. W. 2004, ApJ, 601, 479 [Google Scholar]
- Picquenot, A., Williams, B. J., Acero, F., & Mori, K. 2024, A&A, 683, A197 [NASA ADS] [CrossRef] [EDP Sciences] [Google Scholar]
- Reich, W. 2002, in Neutron Stars, Pulsars, and Supernova Remnants, eds. W. Becker, H. Lesch, & J. Trümper, 1 [Google Scholar]
- Reynolds, S. P., & Aller, H. D. 1988, ApJ, 327, 845 [CrossRef] [Google Scholar]
- Ritter, A., Parker, Q. A., Lykou, F., et al. 2021, ApJ, 918, L33 [NASA ADS] [CrossRef] [Google Scholar]
- Roberts, D. A., Goss, W. M., Kalberla, P. M. W., Herbstmeier, U., & Schwarz, U. J. 1993, A&A, 274, 427 [NASA ADS] [Google Scholar]
- Romani, R. W., Wong, J., Di Lalla, N., et al. 2023, ApJ, 957, 23 [Google Scholar]
- Schaefer, B. E. 2023, MNRAS, 523, 3885 [Google Scholar]
- Shearer, A., & Neustroev, V. V. 2008, MNRAS, 390, 235 [Google Scholar]
- Shibanov, Y. A., Lundqvist, N., Lundqvist, P., Sollerman, J., & Zyuzin, D. 2008, A&A, 486, 273 [NASA ADS] [CrossRef] [EDP Sciences] [Google Scholar]
- Slane, P. O., Helfand, D. J., & Murray, S. S. 2002, ApJ, 571, L45 [Google Scholar]
- Slane, P., Helfand, D. J., van der Swaluw, E., & Murray, S. S. 2004, ApJ, 616, 403 [CrossRef] [Google Scholar]
- Slane, P., Helfand, D. J., Reynolds, S. P., et al. 2008, ApJ, 676, L33 [NASA ADS] [CrossRef] [Google Scholar]
- Stephenson, F. R., & Green, D. A. 2002, Int. Ser. Astron. Astrophys., 5 [Google Scholar]
- Sun, X. H., Reich, P., Reich, W., et al. 2011, A&A, 536, A83 [EDP Sciences] [Google Scholar]
- Torii, K., Slane, P. O., Kinugasa, K., Hashimotodani, K., & Tsunemi, H. 2000, PASJ, 52, 875 [NASA ADS] [CrossRef] [Google Scholar]
- Torres, D. F., Cillis, A. N., & Martín Rodriguez, J. 2013, ApJ, 763, L4 [NASA ADS] [CrossRef] [Google Scholar]
- Vianello, G., Lauer, R. J., Younk, P., et al. 2015, arXiv e-prints [arXiv:1507.08343] [Google Scholar]
- Weisskopf, M. C., Soffitta, P., Baldini, L., et al. 2022, J. Astron. Telesc. Instrum. Syst., 8, 026002 [NASA ADS] [CrossRef] [Google Scholar]
- Wilms, J., Allen, A., & McCray, R. 2000, ApJ, 542, 914 [Google Scholar]
- Wilson, A. S., & Weiler, K. W. 1976, A&A, 49, 357 [Google Scholar]
- Wong, J., Romani, R. W., & Dinsmore, J. T. 2023, ApJ, 953, 28 [NASA ADS] [CrossRef] [Google Scholar]
- Wong, J., Mizuno, T., Bucciantini, N., et al. 2024, ApJ, 973, 172 [NASA ADS] [CrossRef] [Google Scholar]
- Xie, F., Di Marco, A., La Monaca, F., et al. 2022, Nature, 612, 658 [NASA ADS] [CrossRef] [Google Scholar]
- Yao, J. M., Manchester, R. N., & Wang, N. 2017, ApJ, 835, 29 [NASA ADS] [CrossRef] [Google Scholar]
- Zhdankin, V., Werner, G. R., Uzdensky, D. A., & Begelman, M. C. 2017, Phys. Rev. Lett., 118, 055103 [NASA ADS] [CrossRef] [Google Scholar]
See Chandra Supernova Remnant Catalog entry at https://hea-www.harvard.edu/ChandraSNR/G130.7+03.1/
Archival data for solar flaring activity of the GOES satellites can be found at https://www.spaceweatherlive.com/en/solar-activity/solar-flares.html
Accessible at https://www.atnf.csiro.au/research/pulsar/psrcat/
All Tables
All Figures
|
Fig. 1 Comparison of the count spectrum in a 50 arcsec radius centered on the source versus an equal size background region, for background-rejected data before de-flaring. Red shaded regions highlight counts outside the fiducial [2–8] keV energy range for IXPE calibration. |
| In the text | |
|
Fig. 2 Left panel: IXPE total count map in the full 2–8 keV band after background rejection and deflaring. Central panel: maximum likelihood expectation value of the source IXPE counts in the 2–8 keV range, using the method of Ehlert et al. (2022). Right panel: Chandra count flux in the in the 2–8 keV band derived from ObsIDs 728, 3832, 4382, 4383, 25786, 25787, 25788, 25789, 25790, and 26402. |
| In the text | |
|
Fig. 3 Top panel: VLA S-band polarization map of 3C 58, with magnetic field direction overlaid on the total intensity map (Jy per beam). Bottom panel: same as top panel, but for the C-band. |
| In the text | |
|
Fig. 4 Top panel: Polarization angle and degree in a region of 40 arcsec radius centered on the pulsar in the [2–6] keV energy range. Contours represent the 1,2, and 3σ confidence regions. Bottom panel: Polarization degree as a function of the region size for regions centered on the pulsar. Points show IXPE values with their 1σ uncertainty. Solid lines represent the expectations for various models: a polarized inner torus (PD=75%) embedded into an unpolarized external nebula (green); a polarized extended torus (PD=55%) embedded into an unpolarized external nebula (purple); a polarized extended torus (PD=50%) embedded into an external nebula with the same polarization as seen in radio (red); and a nebula having the same polarization as seen in radio (orange). |
| In the text | |
|
Fig. 5 Top panel: IXPE pulse profile for the PSR J0205+6449/3C 58 system, in the [2–6] keV band, within a region of 40 arcsec radius from the pulsar, compared to the analytical model by Kuiper et al. (2010). Bottom panel: phase-resolved polarization degree within the same region, together with the minimum detectable polarization at 99% confidence level. |
| In the text | |
|
Fig. 6 A five-by-five array of 15″ pixels showing the nebula’s magnetic field, rotated 90° from the EVPA, as measured using simultaneous fitting. White bars denote 0.5–1σ significance, yellow bars 1–2σ, and green bars 2–3σ. The pixel field is oriented north-south, as expected for a toroidal magnetic field in the inner nebula. Other pixels show some EVPA variation, possibly following the filamentary structures of the background Chandra image. A flux cut of >700 counts removes spurious polarization vectors in the outskirts. The red bar represents PD=100%. |
| In the text | |
|
Fig. 7 Chandra count flux in the [2–8] keV band of the inner PWN (same as Fig. 2). The outer magenta circle marks the 40 arcsec radius region used in the current analysis. The inner black circle marks the region of the inner torus. The red ellipse marks the region of the extended torus. |
| In the text | |
Current usage metrics show cumulative count of Article Views (full-text article views including HTML views, PDF and ePub downloads, according to the available data) and Abstracts Views on Vision4Press platform.
Data correspond to usage on the plateform after 2015. The current usage metrics is available 48-96 hours after online publication and is updated daily on week days.
Initial download of the metrics may take a while.