Fig. 2
Download original image
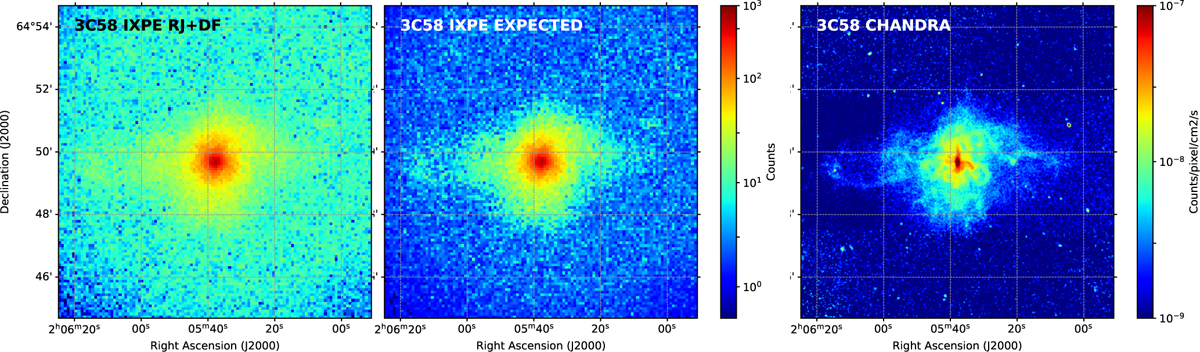
Left panel: IXPE total count map in the full 2–8 keV band after background rejection and deflaring. Central panel: maximum likelihood expectation value of the source IXPE counts in the 2–8 keV range, using the method of Ehlert et al. (2022). Right panel: Chandra count flux in the in the 2–8 keV band derived from ObsIDs 728, 3832, 4382, 4383, 25786, 25787, 25788, 25789, 25790, and 26402.
Current usage metrics show cumulative count of Article Views (full-text article views including HTML views, PDF and ePub downloads, according to the available data) and Abstracts Views on Vision4Press platform.
Data correspond to usage on the plateform after 2015. The current usage metrics is available 48-96 hours after online publication and is updated daily on week days.
Initial download of the metrics may take a while.