Fig. 8.

Download original image
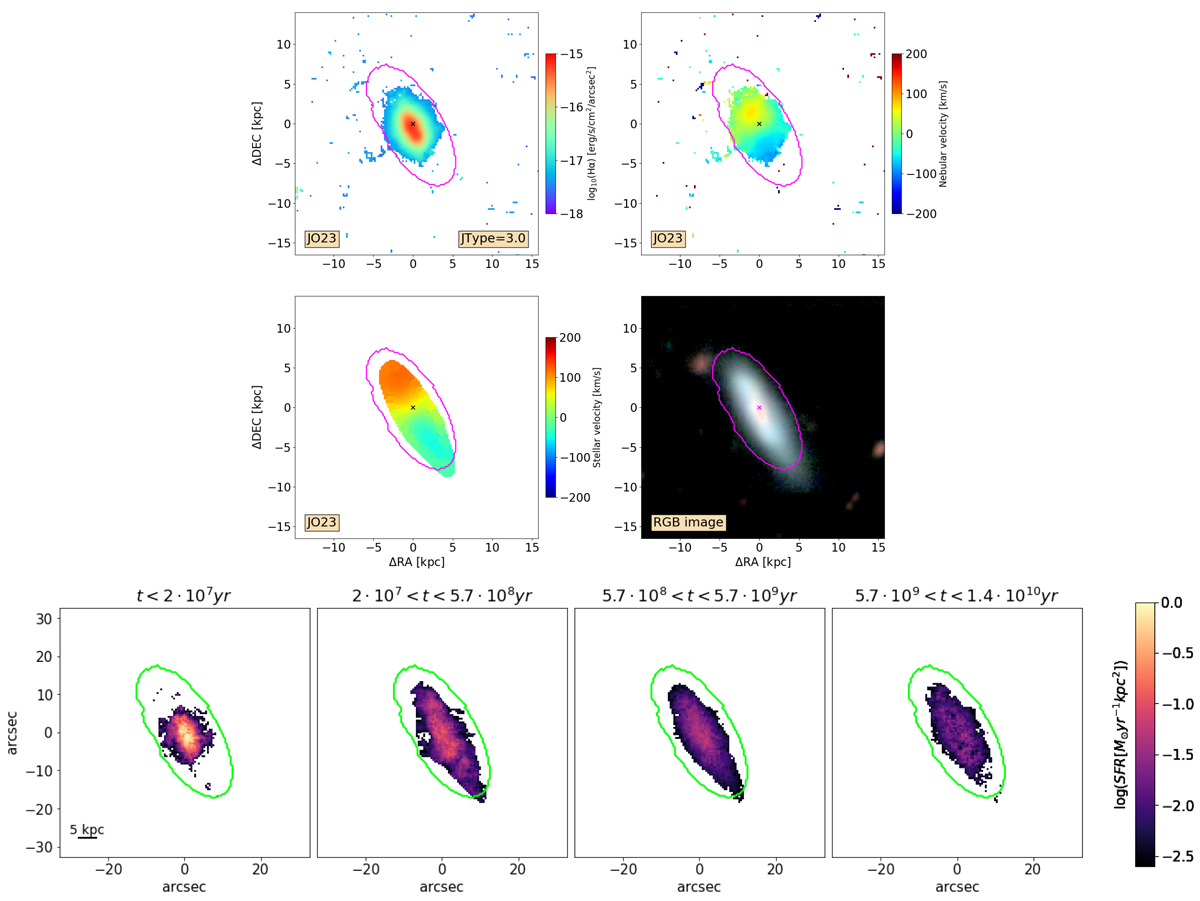
Example of a JType = 3 (truncated galaxy): JO23. Top: Hα flux (top left), the gas kinematics (top right), the stellar kinematics (bottom left), and the color composite image (bottom right). Panels and colors are the same as in Fig. 1. Bottom: Stellar maps of different ages, illustrating the average star formation rate per kpc2 during the last 2×10⁷ yr (left), between 2×10⁷ and 5.7×10⁸ yr (central left), between 5.7×10⁸ and 5.7×10⁹ yr (central right), and >5.7×10⁹ yr ago (right). The green ellipses show the contour that defines the stellar disk (see text for details).
Current usage metrics show cumulative count of Article Views (full-text article views including HTML views, PDF and ePub downloads, according to the available data) and Abstracts Views on Vision4Press platform.
Data correspond to usage on the plateform after 2015. The current usage metrics is available 48-96 hours after online publication and is updated daily on week days.
Initial download of the metrics may take a while.


