| Issue |
A&A
Volume 682, February 2024
|
|
|---|---|---|
| Article Number | A117 | |
| Number of page(s) | 9 | |
| Section | Extragalactic astronomy | |
| DOI | https://doi.org/10.1051/0004-6361/202348135 | |
| Published online | 08 February 2024 | |
Evidence for enhanced star formation rates in z ∼ 0.35 cluster galaxies undergoing ram pressure stripping⋆
1
INAF – Osservatorio astronomico di Padova, Vicolo Osservatorio 5, 35122 Padova, Italy
e-mail: benedetta.vulcani@inaf.it
2
Instituto de Radioastronomia y Astrofisica, UNAM, Campus Morelia, AP 3-72, CP 58089 Morelia, Mexico
3
Univ. Lyon, Univ. Lyon 1, ENS de Lyon, CNRS, Centre de Recherche Astrophysique de Lyon UMR5574, 69230 Saint-Genis-Laval, France
Received:
3
October
2023
Accepted:
22
November
2023
Ram-pressure stripping (RPS) is the mechanism most often invoked to explain the observed differences between cluster and field galaxies. In the local Universe, its effect on the star-forming properties of the galaxies has been largely elucidated and the general consensus is that this process first compresses the gas available in galaxy disks, boosting the star formation for a limited amount of time, and then removes the remaining gas, leading to quenching. Much less is known about the effect and preponderance of RPS at higher redshifts, due to the lack of statistical samples. Exploiting VLT/MUSE observations of galaxies at 0.2 < z < 0.55 and a published catalog of ram-pressure-stripped galaxies, we compare the global star formation rate–mass (SFR–M*) relation of 29 cluster galaxies undergoing RPS to that of 26 undisturbed field and cluster galaxies that constitute our control sample. Stripping galaxies occupy the upper envelope of the SFR–M* relation of the control sample, showing a systematic enhancement of SFR at any given mass. The boost is > 3σ when considering the SFR occurring in both the tail and the disk of the galaxies. The enhancement is also seen on local scales: Considering spatially resolved data, ram-pressure stripped galaxies have large ΣSFR values overall, especially for Σ* > 107.5 M⊙ kpc−2. RPS seems to leave the same imprint on the SFR–M* and ΣSFR–Σ* relations both in the local Universe and at z ∼ 0.35.
Key words: galaxies: clusters: general / galaxies: evolution / galaxies: formation / galaxies: general / galaxies: star formation
Full Table 1 is available at the CDS via anonymous ftp to cdsarc.cds.unistra.fr (130.79.128.5) or via https://cdsarc.cds.unistra.fr/viz-bin/cat/J/A+A/682/A117
© The Authors 2024
 Open Access article, published by EDP Sciences, under the terms of the Creative Commons Attribution License (https://creativecommons.org/licenses/by/4.0), which permits unrestricted use, distribution, and reproduction in any medium, provided the original work is properly cited.
This article is published in open access under the Subscribe to Open model. Subscribe to A&A to support open access publication.
1. Introduction
Multiple observations provide evidence that galaxies residing in dense cluster environments follow an evolutionary pathway distinct from that of their counterparts in less crowded regions of the Universe. For example, group and cluster galaxies are HI deficient (Giovanelli & Haynes 1985), have redder colors (Kennicutt 1983; Kodama et al. 2001) and a lower star formation rate (SFR; Bower & Balogh 2004; Vulcani et al. 2010; Pérez-Millán et al. 2023), and exhibit nondisky morphologies more frequently (Dressler 1980; Vulcani et al. 2023a) than similar-mass analogs in the field. Such differences arise from the fact that as galaxies navigate the high-density environments of clusters or groups, their properties can be profoundly impacted by various physical processes, such as tidal interactions (Moore et al. 1996), starvation or strangulation (Larson et al. 1980), ram pressure stripping (RPS; Gunn & Gott 1972), and, to a lesser extent, galaxy–galaxy interactions. These mechanisms can alter the availability of cold gas within galaxies, which in turn influences their ability to form stars. In particular, RPS has been shown to be capable of extracting both the loosely bound circumgalactic medium (CGM) and the cold and dense interstellar medium (ISM) from galaxies, producing tails of gas in the direction opposite to their direction of motion (e.g., Cortese et al. 2007; Yagi et al. 2007; Sun et al. 2010; Fumagalli et al. 2014; Poggianti et al. 2017; Gullieuszik et al. 2017; Bellhouse et al. 2017; Jáchym et al. 2017; Cramer et al. 2019; Moretti et al. 2020; Bacchini et al. 2023).
As RPS removes the interstellar gas reservoirs, its long-term impact is to suppress and even halt star formation in cluster galaxies (Vollmer et al. 2001; Tonnesen et al. 2007; Vulcani et al. 2020a). Nonetheless, multiple observations have shown that, at least in the local Universe, galaxies undergoing RPS exhibit a burst in star formation in their disks due to gas compression (Poggianti et al. 2016; Vulcani et al. 2018; Roberts et al. 2020, 2022; Boselli et al. 2023) or to ram-pressure-driven mass flows (Zhu et al. 2024), and star formation can be induced in the tails as well (Vulcani et al. 2018; Cramer et al. 2019; Jáchym et al. 2019; Gullieuszik et al. 2020; Poggianti et al. 2019). As a result, according to these observations, ram-pressure stripped galaxies are characterized by a globally enhanced SFR (Vulcani et al. 2018, 2020b; Ramatsoku et al. 2020; Roberts et al. 2020) in comparison to normal star-forming galaxies in clusters and in the field. Concomitently, other observations reveal no signs of enhanced SFR or even find this latter to be reduced in ram-pressure stripped galaxies (Yoon et al. 2017; Mun et al. 2021), leaving the true effect of RPS on SFR an open question.
From the theoretical point of view, many efforts have been made to simulate ram-pressure stripped galaxies, with a variety of codes, techniques, and included physical processes. Different simulation approaches have led to different outcomes. Simulations relying on wind-tunnel setups generally find that RPS boosts the SFR (Kronberger et al. 2008; Kapferer et al. 2009; Tonnesen & Bryan 2012; Roediger et al. 2014).
Exploring hydrodynamical simulations, Steinhauser et al. (2016) found a general enhancement of SFR only for galaxies experiencing mild ram pressure, and Ramos-Martínez et al. (2018) showed that magnetic fields can channel gas to the center of the galaxy where it can be a reservoir for star formation.
Exploiting full cosmological galaxy simulations, Troncoso-Iribarren et al. (2016, 2020) showed that the EAGLE (Schaye et al. 2015) simulation predicts an enhancement of star formation in the so-called leading half of a galaxy falling into a cluster, whereas in the trailing half no increase in SFR is found. In contrast, the TNG50 simulation (Pillepich et al. 2019; Nelson et al. 2019) does not predict higher SFRs in ram-pressure-stripped galaxies compared to analogous cluster galaxies with the same stellar mass or gas fraction (Göller et al. 2023). Nonetheless, this latter simulation does predict both star formation within the ram-pressure-stripped tails and bursts of elevated star formation throughout the history of stripped galaxies, even though these do not impact the global SFR values (Göller et al. 2023).
All the studies cited above focused on characterizing the consequences of stripping on the galaxy life cycle in the local Universe, where most of the systematic observational efforts have been conducted (e.g., GASP, Poggianti et al. 2017; VIVA, Chung et al. 2009; LoTSS, Roberts et al. 2021). Much less is known at z ≥ 0.1. Numerical simulations (Singh et al. 2019) and analytic prescriptions (Fujita 2001) predict an amplification of RPS efficacy as redshift increases due to the dependence of RPS on the density of the ICM (Kravtsov & Borgani 2012; Mostoghiu et al. 2019). Observationally, only a limited number of systematic searches have been executed (e.g., Cortese et al. 2007). Owers et al. (2012), Ebeling et al. (2014), Rawle et al. (2014), McPartland et al. (2016), Durret et al. (2021) exploited Hubble Space Telescope (HST) imaging and identified RPS candidates characterized by star-forming tails emitting in the bluer HST bands at 0.3 < z < 0.7. However, lacking spectroscopic confirmation in most cases (except for Owers et al. 2012; Rawle et al. 2014), these galaxies remain candidates and are not confirmed as undergoing ram pressure stripping. The first detailed characterization of a ram-pressure-stripped galaxy at z ∼ 0.7 was made possible thanks to the advent of the Multi Unit Spectroscopic Explorer at the Very Large Telescope (MUSE/VLT) Integral field spectrograph (Boselli et al. 2019). Exploiting the MUSE Guaranteed Time Observations (GTO) data (Bacon et al. 2017; Richard et al. 2021), Moretti et al. (2022) and Moretti et al. (in prep.), assembled the first – and only, to this day – large sample of spectroscopically confirmed ram-pressure-stripped galaxies at intermediate redshift (z ∼ 0.3–0.5). It is now possible to investigate the properties of ionized gas tails due to ongoing RPS beyond the local Universe, providing us with the possibility to decipher whether the effect of this process on galaxies varies with time.
In the present paper, we exploit the Moretti et al. (in prep.) catalog and delve into the multifaceted nature of the SFR–stellar mass (SFR–M*) relation for cluster galaxies undergoing RPS at z ∼ 0.35. While, in general, a well-defined correlation between SFR and mass exists (Noeske et al. 2007a,b), with more massive galaxies exhibiting higher rates of star formation because of their larger gas reservoirs, the many cluster specific mechanisms, and in particular RPS, can have profound effects on the ability of a galaxy to form new stars, and consequently impact its position on the SFR–M* relation. Exploiting the GASP sample, Vulcani et al. (2018) found that stripping galaxies occupy the upper envelope of the SFR–M* relation of a control sample (made of undisturbed galaxies in different environments), revealing a systematic enhancement of the SFR at any given stellar mass. Exploiting spatially resolved data to investigate the origin and location of the excess, Vulcani et al. (2020b) found that even on ∼1 kpc scales, stripping galaxies present a systematic enhancement of SFR density (ΣSFR) at any given mass density (Σ*) compared to their undisturbed counterparts. This enhancement is proportional to the global SFR enhancement for both stripped and nonstripped galaxies.
In the present paper, we aim to establish whether or not RPS is able to significantly affect the star-forming properties of galaxies at z ∼ 0.35 as it does in the local Universe, for the first time on a statistically significant sample. A similar attempt was already made by Lee et al. (2022), who, using Gemini GMOS/IFU observations of only five ram-pressure-stripped galaxies at z ∼ 0.3 − 0.4, indeed found hints for an increase in star formation compared to undisturbed galaxies.
The paper is organized as follows: Sect. 2 presents the data sample and the sample selection, Sect. 3 summarizes the techniques adopted to extract the quantities of interest for our analysis, and Sect. 4 presents the results of the analysis. We characterize both the global and spatially resolved SFR–M* relations. Finally, in Sect. 5 we summarize and discuss our results.
Throughout the paper, we adopt a Chabrier (2003) initial mass function (IMF) in the mass range of 0.1–100 M⊙. The cosmological constants assumed are Ωm = 0.3, ΩΛ = 0.7, and H0 = 70 km s−1 Mpc−1.
2. Data sample and sample selection
We exploit MUSE observations gathered in the context of the MUSE GTO (Richard et al. 2021), which observed a set of clusters extracted from the Massive Clusters Survey (Ebeling et al. 2001), Frontier Fields (Lotz et al. 2016), GLASS (Treu et al. 2015), and Cluster Lensing and Supernova survey with Hubble (Postman et al. 2012) programmes. Clusters were observed with single pointings or mosaics, with exposure times ranging from ∼2 to ∼15 h (effective). Observations were limited to only the central regions of the clusters: the radius of the typical area covered by MUSE observations corresponds to ∼250–330 kpc, depending on the cluster’s redshift, roughly matching the inner ∼0.1–0.15 R200. The 5σ emission-line detection limit for a point-like source is within the range of (0.77–1.5)∼10−18 erg s−1 cm−2 at 7000 Å. More details on the observations and data analysis can be found in Richard et al. (2021).
Given the seeing conditions of the MUSE observations, we can characterize galaxy properties on a scale of 4–6 kpc/″, depending on redshift. As described in Moretti et al. (2022) and Werle et al. (2022), we selected 12 clusters in the redshift range 0.3 < z < 0.5 and identified (1) galaxies in the clusters and undergoing RPS; (2) galaxies in the clusters or coeval field appearing undisturbed; and (3) passive galaxies. Three of us (B.P., B.V., and M.G.) inspected the MUSE data cubes and the HST RGB images (F435W+F606W+F814W). Galaxies undergoing RPS were identified by searching for extraplanar, unilateral tails and/or debris with emission lines in the MUSE data cubes and/or unilateral tails and/or debris from HST images that were confirmed to belong to the galaxy from the MUSE redshifts. Passive galaxies were classified based on the lack of emission lines; undisturbed galaxies are selected for having a magnitude in the F606W band of brighter than 23.5 mag, being in the redshift range 0.2 < z < 0.55, and not showing peculiar features or asymmetries in their emission-line morphology.
Sample selection. In this analysis, we aim to characterize the star-forming properties of galaxies. We use the Hα emission as a tracer of star formation, and use Hα, OI, Hβ, and [NII] to select star-forming regions (see below). We therefore apply a redshift cut to the sample (z < 0.42) in order to ensure that all lines are within the MUSE wavelength coverage. We then consider all galaxies in the sample that are either ram-pressure stripped or undisturbed and that have a non-negligible total SFR (they can be devoid of ionized gas in the center but still have a star-forming tail), for a total of 29 ram-pressure-stripped and 26 control-sample galaxies (16 in the clusters, 10 in the field). We note that due to the small number statistics, we cannot separate field galaxies from cluster galaxies in our control sample and from now on we treat them together for the sake of a statistically robust analysis, although some environmental effects could still play a role (e.g., Vulcani et al. 2019; Franchetto et al. 2021a). Among the ram-pressure-stripped galaxies, 25 show ionized tails, while four are truncated disks.
3. Data analysis
As discussed in Moretti et al. (2022), we corrected the reduced datacube for extinction due to our Galaxy and subtracted the stellar-only component of each spectrum derived with the spectrophotometric code SINOPSIS (Fritz et al. 2017). In addition to the best-fit stellar-only model cube that is subtracted from the observed cube, SINOPSIS provides stellar masses, luminosity-weighted and mass-weighted ages, and star formation histories in four broad age bins for each MUSE spaxel. For more details, we refer to Fritz et al. (2017),
We then derived emission line fluxes with associated errors using HIGHELF (Radovich et al., in prep.). We only consider as reliable those spaxels with S/N (Hα, Hβ, [OIII]5007, [NII]) > 2. The data reach a surface-brightness detection limit of log(Hα [erg s−1 cm−2 arcsec−2]) ∼ −17.6 at the 2σ confidence level. Hα luminosities corrected both for stellar absorption and for dust extinction were used to compute SFRs, adopting the Kennicutt (1998) relation: SFR(M⊙ yr−1) = 4.6 × 10−42LHα(erg s). The extinction was estimated from the Balmer decrement assuming an intrinsic value of Hα/Hβ = 2.86 and the Cardelli et al. (1989) extinction law. As the formal errors obtained by HIGHELF are negligible with respect to the uncertainties deriving from the conversion from luminosities to SFR, we assume a relative uncertainty of 20% on the measured SFRs (Kennicutt et al. 2009). We note that 95% of the spaxels used in our analysis have a S/N > 5 and the bulk of the spaxels have S/N ∼ 30, and therefore their formal error is significantly smaller than the adopted 20%.
We employed the standard diagnostic diagram [OIII]5007/Hβ versus [NII]/Hα (Baldwin et al. 1981) to separate the regions where the gas is ionized by star formation from regions powered by active galactic nuclei (AGN) or low-ionization nuclear emission-line (LINER) emission. We adopted the division lines by Kewley et al. (2001) and Kauffmann et al. (2003). For the majority of the galaxies, most of the Hα emission is powered by photoionization (plots not shown). Two galaxies (both undergoing ram pressure stripping) in the sample host an AGN: SMACS2031_01 and A370_06 (see also Moretti et al. 2022). To compute SFRs, we considered only the spaxels for which ionized flux is powered by star formation or those that belong to the region of composite ionizing sources defined by Kauffmann et al. (2003) in the BPT diagram1.
We compute the total stellar mass and SFR of galaxies by summing the values of all of the spaxels belonging to each galaxy and powered by star formation according to the BPT and we assume uncertainties on the SFR of 20% of these computed values (Kennicutt et al. 2009) in order to take into account the uncertainties on the conversion factor from luminosity to SFR. To define the stellar disk region, we used the definition of galaxy boundaries developed by Moretti et al. (2022). The adopted procedure is based on the MUSE g-band reconstructed image. For each galaxy, we identified the surface brightness of the sky background by masking the galaxy itself and the neighbors, if any, and then identified the stellar isophote corresponding to a surface brightness 3σ above the measured sky background level. In the presence of neighbors, we adjusted the isophotes to remove their contributions. As the resulting isophote can be quite jagged, we fit an ellipse to the isophote. Everything inside of this contour represents the stellar disk; the rest constitutes the galaxy “tail”. Stellar masses were computed only within the ellipse defining the stellar disk, while for SFR we also contrast disk and total (disk+tail) values. By definition, the galaxies of the control sample have negligible Hα flux (and therefore negligible SFR) outside of the ellipse defining the stellar disk. An extract of the properties of the galaxies used in this work is given in Table 1, while the full table is available at the CDS.
Properties of the galaxies analyzed in this paper.
4. Results
4.1. Global SFR–mass relation
Figure 1 shows the stellar mass (left) and the disk specific star formation rate (sSFR = SFRdisk/M*, right) distributions for ram-pressure-stripped and control sample galaxies. No clear differences emerge from the mass distributions: both the median values are compatible and the Kolmogorov–Smirnov (KS) test is unable to detect different parent distributions (statistic = 0.20, p-value = 0.49). Considering the sSFR distributions, the median value of ram-pressure-stripped galaxies is shifted toward larger values, but again the KS test is not able to retrieve any significant difference (statistic = 0.25, p-value = 0.28). This is most likely due to the small sample size. In the right panel of Fig. 1, we also report the adopted separation between star-forming and quiescent galaxies, which we set at sSFRdisk = 10−11.5 yr−1, as typically adopted in the literature (e.g., Salim et al. 2016). Three galaxies fall below this threshold. In the following, even though we plot all galaxies, when performing the statistical analysis, we only consider galaxies that have a star-forming disk.
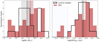 |
Fig. 1. Characterization of the sample. Mass distribution (left) and disk SSFR (right) of the galaxies in the samples. Vertical lines and shaded areas show the median values with the uncertainties computed as errors on the median. In the right panel, the blue shaded area indicates the region where SFRdisk/M⊙ > 10−11.5 yr−1. |
Figure 2 shows the main result of this paper: the SFR–M* relation for galaxies undergoing RPS compared to that of the control sample. Among ram-pressure-stripped galaxies, those with tails populate the upper envelope of the relation seen in the control sample. This is true both when considering the SFRdisk values (filled red stars) and – to a greater extent – when considering the total (disk+tail) SFRs (empty purple stars). Truncated disks (filled red triangles) instead tend to populate the lower envelope of the relation seen in the control sample, except for one case (MACS0416N_01), which is lies on the relation of the control sample. Results are not driven by galaxy inclination angle: no significant trends are observed when inclination is taken into account (plot not shown).
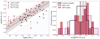 |
Fig. 2. Comparison between the star-forming properties of ram-pressure-stripped and undisturbed galaxies. Left: SFR–mass relation for ram-pressure-stripped galaxies (stars) and control sample galaxies (black circles). For ram-pressure-stripped galaxies, filled red symbols refer to the SFR measured within the disk, and empty purple symbols refer to the total SFR (disk+tail). Stars represent ram-pressure-stripped galaxies with ionized tails, and triangles show truncated disks. For each ram-pressure-stripped galaxy, the disk and total SFRs are connected by a line. If no empty star is plotted, this means that the total and disk SFRs are comparable (hence the tail SFR is negligible). The black line and shaded gray regions show the best fit and 1σ uncertainties for the control sample, while the red line and shaded red regions show the best fit and 1σ uncertainties for the ram-pressure-stripped sample when the SFRdisk is considered. The best fit obtained considering the total SFR is not shown for the sake of clarity. Best-fit values are reported in Table 2. The dashed blue region indicates the plane where sSFRdisk < 10−11.5 yr−1. Right: distributions of the differences between the galaxy SFRs and their expected value according to the fit to the control sample, given their mass. Vertical lines and shaded areas show the mean values of the distributions along with uncertainties. Black and gray colors refer to the control sample, and red (purple) colors show the values for the ram-pressure-stripped galaxies when the SFR in the disk (tot) is considered. |
To statistically quantify the differences shown in Fig. 2, we fit a linear relation to each of the datasets (considering RPS with tails and truncated disks together) using a least square fitting method that takes into account uncertainties on both axes. In all cases, we assume the slope and intercept to be free parameters. The best-fit values and the scatter of the relation are reported in Table 2. When considering SFRdisk, ram-pressure-stripped and control sample galaxies are characterized by relations with very similar slopes, but the intercept is higher for the ram-pressure-stripped galaxies. The best-fit relation instead flattens out when considering total SFR. All relations are characterized by a similar scatter σ. Considering the upper 1σ envelope of the best-fit relation of the control sample, the fractions of galaxies above such relation are: 0.3 ± 0.1 when considering SFRdisk, 0.4 ± 0.1 when considering SFRtot of ram-pressure-stripped galaxies, 0.08 when considering the control sample. If we repeat the fit whilst fixing the slope for the ram-pressure-stripped galaxy sample at the value obtained for the control sample, we still obtain a difference in intercept of ∼0.3 − 0.4 dex depending on the sample, in the sense that ram-pressure-stripped galaxies are systematically above, although differences are not statistically significant.
This result indicates that galaxies experiencing the effects of RPS show an enhancement in SFR in the regions within the stellar disk with respect to control sample galaxies of similar mass. The same result is found when the SFR in the tails is considered. While in principle we should not compare the disk+tail SFR of the ram-pressure-stripped galaxies to the disk-only SFR of the control sample galaxies, we remind the reader that, by definition, control sample galaxies have no tails, and therefore they have SFRtail = 0. Nevertheless, to quantify the role of RPS, it is important to quantify all the SFR induced by this mechanism. Although the ISM conditions are different in the tails with respect to those in the disks and the star formation there is an indirect consequence of RPS, which only strips the gas that will eventually form new stars, we cannot neglect this effect.
Differences between the various samples are better seen in the right panel of Fig. 2, which shows the distribution of the difference between the SFR of each galaxy and the value derived from the control sample fit given the galaxy mass. While a group of galaxies with reduced SFR is visible in all the samples, suggesting the presence of galaxies with a suppressed SFR, most of the stripping galaxies have a higher measured SFR than that expected given the fit, implying that their distribution is skewed toward higher values and is also broader. This result holds both when considering SFRdisk and SFRtot, but is more evident in the second case. The KS test is able to retrieve significant differences between the control sample and the stripping sample when the SFRtot is considered (statistic = 0.35, pvalue = 0.05), while results are not significant when the disk SFR is considered (statistic = 0.3, p-value = 0.19). While by construction the control mean value is centered at 0 (0 ± 0.08 dex), the mean values of the stripped galaxies distributions are as follows: Δlog(SFRdisk) = 0.23 ± 0.09 dex and Δlog(SFRtot) = 0.45 ± 0.09 dex. Therefore, mean values are different at the 1.8(3.4)σ level when considering the disk (total) SFRs.
Figure 3 better quantifies the difference between the disk and total SFR for ram-pressure-stripped galaxies. In 11 out of 25 galaxies with tails, the tail SFR is non-negligible and the total SFR is 1.25 times higher than the disk SFR. No trends with stellar mass or inclination (plot not shown) emerge.
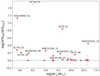 |
Fig. 3. Logarithmic difference between the total SFR and the disk SFR as a function of stellar mass for ram-pressure-stripped galaxies. Galaxies with a difference of greater than 0.1 dex are labeled. A2744_01, which has SDRdisk = 0, is artificially located at y = 1.5. Error bars are obtained by summing the errors on measurements in quadrature. |
4.2. Spatially resolved SFR–mass relation in the galaxy disks
We now present a more detailed investigation of the properties of galaxies located in different regions of the SFR–M* plane. The aim here is to look for additional evidence of the effect of RPS on galaxy properties. To do so, adopting the control sample best fit and its scatter, we considered four different regions of Fig. 2:
-
galaxies with SFRdisk > SFRcs-fit + 1σ (enhanced)
-
galaxies with SFRcs-fit < SFRdisk < SFRcs-fit + 1σ (above the main sequence2)
-
galaxies with SFRcs-fit − 1σ < SFRdisk < SFRcs-fit (below the main sequence)
-
galaxies with SFRdisk < SFRcs-fit − 1σ (suppressed),
where SFRcs-fit is the SFR estimated from the fit for the control sample at any given mass and 1σ is the standard deviation of the fit. The number of galaxies in each of the four groups is reported in Table 3. The different distribution of galaxies in the different regions is clear, with ram-pressure-stripped galaxies residing preferentially in the upper region of the plane, as already discussed.
Figure 4 compares the spatially resolved SFR–M* relation (ΣSFR − Σ*) for galaxies in the different regions of the SFR–M* plane, both those affected and unaffected by RPS. For fair comparisons, only spaxels within the galaxy disks are considered. Values are deprojected by considering the axis ratio of the ellipse defining the disk. In total, 3271 points are plotted for the control sample galaxies, and 4368 points are plotted for the ram-pressure-stripped galaxies.
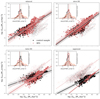 |
Fig. 4. Spatially resolved SFR–mass relation for galaxies in different regions of the global SFR–mass plane. Top left: enhanced region. Top right: above MS region. Bottom left: below MS region. Bottom left: suppressed region. Small symbols show the distribution of all points regardless of their position on the SFR–mass plane and are reported in all panels. Black points are the spaxels of control sample galaxies, black lines and gray-shaded areas show the control sample best fits along with the scatter, respectively, red stars are the spaxels for RPS galaxies, and red lines and shaded areas show the corresponding best fits and the scatter, respectively. In the suppressed panel, we cannot perform the fit to the RPS points because of their small sample statistics. In all panels, the best fit for the enhanced ram-pressure-stripped line is also reported in red to ease comparisons. The inset of each panel reports the distributions of the differences between the spatially resolved galaxy SFRs and their expected values according to the best fit to the control sample given their spatially resolved mass and considering the galaxies in that SFR–mass region. Vertical lines and shaded areas show the mean values of the distributions along with uncertainties. Black and gray colors refer to the control sample, and red colors show the values for the ram-pressure-stripped galaxies. In each inset, the same distributions and mean values considering all galaxies together are also reported (filled histogram and gray lines refer to the control sample, filled histogram and coral lines to the ram-pressure-stripped sample). |
Overall, a correlation exists between ΣSFR and Σ* on scales of a few kiloparsecs, similarly to what is seen in the local Universe (Ellison et al. 2018; Vulcani et al. 2019; Brown et al. 2023). While the plot considering the different zones together shows a relatively large amount of scatter (small colored symbols plotted in the background of all plots) – indicating significant variation in star-forming properties from one galaxy to another on local scales, similarly to what is seen by Vulcani et al. (2019, 2020b) – cleaner trends emerge when galaxies are divided into the four groups. In each panel, galaxies cover similar regions of the plane irrespective of whether or not RPS is ongoing. Nonetheless, distinct subrelations appear and these correspond to different galaxies: to some extent, each object spans a different locus of the ΣSFR–Σ* plane. In addition, the relative distribution of points in the different panels depends on the sample: in the case of the control sample, 13.8 ± 0.6% of the data points are in the enhanced region, 37.2 ± 0.8% are in the region above the main sequence, 32.3 ± 0.8% are in the region below the main sequence, and 16.7 ± 0.6% are in the suppressed region. The corresponding fractions for the ram-pressure-stripped samples are as follows: 21.7 ± 0.6%, 35.3 ± 0.7%, 26.6 ± 0.6%, and 16.4 ± 0.5%. The distribution of the spaxels in the different regions seems not to depend on the galaxy total stellar, nor inclination nor their galactocentric distance (plots not shown). Vulcani et al. (2019) did find that relations are driven by the presence of bright star-forming clumps spread across the galaxy disks, but the poor spatial resolution of MUSE data at z ∼ 0.35, which is ∼5 kpc/″, prevents us from understanding whether or not this is also the case at this epoch.
Considering each panel of Fig. 4 separately, the best-fit parameters of the linear relation fitted to the different samples (Table 4) show that all trends for the ram-pressure-stripped samples are slightly steeper than for the control sample relation, suggesting enhanced ΣSFR at high Σ* values3. Overall, comparing the best-fit parameters for a given sample across the different panels, we find a progressive flattening of the relations as we move down along the global SFR–M* plane. In the insets, the distributions of the differences between the galaxy ΣSFR and their expected values according to the best fit to the control sample in that region given their Σ* are reported in red for ram-pressure-stripped galaxies and in black for the control sample, along with mean values. Distributions of the ram-pressure-stripped samples are systematically shifted towards larger values, except for the region below the main sequence. Both the KS test and the comparison of the mean values support this finding: the KS test run pairwise recovers significant differences (p-value < 0.0005) in all cases. In each inset, filled histograms also report, for comparison, the distributions of the differences between the galaxy ΣSFR and their expected values according to the best fit to the full control sample when galaxies are considered together. In this case, differences are even more enhanced: the ram-pressure-stripped sample is shifted towards larger Δ values at > 10σ. This result is mainly driven by the larger density of points in the enhanced region of ram-pressure-stripped galaxies.
In summary, similarly to the findings of Vulcani et al. (2020b) for the local Universe, galaxies above the global SFR–M* relation are also found above the spatially resolved ΣSFR–Σ* relation, which means that, in those galaxy regions that still sustain star formation, ram-pressure-stripped galaxies form stars at a higher rate per unit of galaxy area than undisturbed galaxies. Taking all galaxies together, ram-pressure-stripped galaxies show an enhancement in ΣSFR at any given Σ*. This enhancement is more pronounced at higher Σ* values (Σ* > 107.5 M⊙ kpc−2), which is in agreement with results at low z (Vulcani et al. 2020b).
5. Summary and discussion
In the local Universe, multiple observations point to an enhancement of the SFR in cluster galaxies undergoing ram-pressure stripping (e.g., Poggianti et al. 2016; Vulcani et al. 2018, 2019; Roberts et al. 2020). This result is supported by theoretical works in some cases (e.g., Kronberger et al. 2008; Tonnesen & Bryan 2012; Roediger et al. 2014; Troncoso-Iribarren et al. 2020), although some other studies do not predict such a trend (Göller et al. 2023).
In this paper, we take a robust and statistically significant approach to investigate, for the first time, the effects of RPS on the star-forming properties of galaxies beyond the local Universe. Moretti et al. (2022) and Moretti et al. (in prep.) have assembled the largest sample of ram-pressure-stripped galaxies at z ∼ 0.35 with available spatially resolved spectroscopy and reliable classification, exploiting MUSE observations gathered by the MUSE GTO (Richard et al. 2021). These authors also assembled a coeval control sample of cluster and field galaxies not affected by RPS, allowing us to perform systematic comparisons between the different samples.
We measured SFRs from Hα emission for 29 ram-pressure-stripped galaxies (25 with ionized tails, 4 truncated disks) and 26 control-sample galaxies. For the ram-pressure-stripped sample, we consider both the SFR within the galaxy disk and the SFR generated in the stripped tails. Both considering only the disk SFR and the disk+tail SFR, we find that ram-pressure-stripped galaxies are characterized by a much steeper SFR–M* relation than control sample galaxies, confirming the results of Lee et al. (2022), which are based on a sample of five ram-pressure-stripped galaxies. The best-fit parameters are different at the ∼2σ level when the disk SFR is considered. Considering the difference between the observed SFR and that expected given the control sample best fit and the mass of each galaxy, we find that galaxies in the ram-pressure-stripped sample are characterized by a clear enhancement in SFR with respect to their control-sample counterparts. The difference between the mean control sample value and the ram-pressure-stripped sample is 0.3 dex when the disk SFR is considered (1.8σ significance) and 0.44 dex when the total SFR is considered (3.4σ significance).
We note that this difference might also be a lower limit. Even though we corrected SFRs for the presence of dust using the Balmer decrement, a large amount of dust-enshrouded star formation could characterize ram-pressure-stripped galaxies (Rawle et al. 2014). Vulcani et al. (2023b) analyzed the JWST/NIRSpec spectrum for one of the galaxies in our sample (A2477_10), showing it to be dominated by a strong polycyclic aromatic hydrocarbon (PAH) feature in emission at 3.3 μm, a line typically considered as a tracer of dust-obscured star formation (Peeters et al. 2004; Brandl et al. 2006). More generally, Vulcani et al. (2023b), analyzing JWST/NIRCam data of all galaxies in Abell 2744, found that the ram-pressure-stripped ones (which also enter our sample) are characterized by extremely red F200W–F444W colors, hypothesizing that this class of objects is indeed characterized by dust-obscured star formation, which is invisible at optical wavelengths. Larger coverage of NIRSpec data – mapping the entire galaxies – is needed to securely establish the connection between red IR color and the presence of the PAH mentioned.
Thanks to the MUSE data, we can also investigate the spatially resolved SFR–mass relation on a spatial scale of approximately 5 kpc/″. Overall, the ram-pressure-stripped sample is characterized by a steeper ΣSFR–Σ* relation and the SFR enhancement is also retrieved on the local scale. Controlling for the location of galaxies on the global SFR–mass plane, differences are reduced, but are still present overall.
In conclusion, we retrieved most of the trends observed in ram-pressure-stripped galaxies in the local Universe (Vulcani et al. 2018, 2019, 2020b; Brown et al. 2023), showing how RPS affects the star-forming properties of galaxies at z ∼ 0.35. Similarly, Khormal & Poggianti (in prep.) has shown that RPS also has effects similar to those in the local Universe in terms of gas abundances, with ram-pressure-stripped tails being characterized by low metallicities due to the interaction between the ICM and ISM (Franchetto et al. 2021b). What remains to be addressed is the effective role of ram pressure in the quenching and morphological transformations that are known to have involved a large fraction of today’s cluster galaxies since z ∼ 1 (Pallero et al. 2019; Pintos-Castro et al. 2019), and at what moment in the history of the Universe ram pressure started to play a significant role also remains to be determined.
The term main sequence generally refers to an approximately linear relation between the SFR and M* of star-forming galaxies (e.g., Noeske et al. 2007a,b).
Acknowledgments
This project has received funding from the European Research Council (ERC) under the Horizon 2020 research and innovation programme (grant agreement N. 833824).
References
- Bacchini, C., Mingozzi, M., Poggianti, B. M., et al. 2023, ApJ, 950, 24 [NASA ADS] [CrossRef] [Google Scholar]
- Bacon, R., Conseil, S., Mary, D., et al. 2017, A&A, 608, A1 [NASA ADS] [CrossRef] [EDP Sciences] [Google Scholar]
- Baldwin, J. A., Phillips, M. M., & Terlevich, R. 1981, PASP, 93, 5 [Google Scholar]
- Bellhouse, C., Jaffé, Y., Hau, G., et al. 2017, ApJ, 844, 49 [NASA ADS] [CrossRef] [Google Scholar]
- Boselli, A., Epinat, B., Contini, T., et al. 2019, A&A, 631, A114 [NASA ADS] [CrossRef] [EDP Sciences] [Google Scholar]
- Boselli, A., Fossati, M., Côté, P., et al. 2023, A&A, 675, A123 [NASA ADS] [CrossRef] [EDP Sciences] [Google Scholar]
- Bower, R. G., & Balogh, M. L. 2004, in Clusters of Galaxies: Probes of Cosmological Structure and Galaxy Evolution, eds. J. S. Mulchaey, A. Dressler, & A. Oemler (Cambridge University Press), 325 [Google Scholar]
- Brandl, B. R., Bernardl-Salas, J., Spoon, H. W. W., et al. 2006, ApJ, 653, 1129 [NASA ADS] [CrossRef] [Google Scholar]
- Brown, T., Roberts, I. D., Thorp, M., et al. 2023, ApJ, 956, 37 [NASA ADS] [CrossRef] [Google Scholar]
- Cardelli, J. A., Clayton, G. C., & Mathis, J. S. 1989, ApJ, 345, 245 [Google Scholar]
- Chabrier, G. 2003, PASP, 115, 763 [Google Scholar]
- Chung, A., Van Gorkom, J. H., Kenney, J. D., Crowl, H., & Vollmer, B. 2009, AJ, 138, 1741 [NASA ADS] [CrossRef] [Google Scholar]
- Cortese, L., Marcillac, D., Richard, J., et al. 2007, MNRAS, 376, 157 [Google Scholar]
- Cramer, W. J., Kenney, J. D. P., Sun, M., et al. 2019, ApJ, 870, 63 [Google Scholar]
- Dressler, A. 1980, ApJ, 236, 351 [Google Scholar]
- Durret, F., Chiche, S., Lobo, C., & Jauzac, M. 2021, A&A, 648, A63 [NASA ADS] [CrossRef] [EDP Sciences] [Google Scholar]
- Ebeling, H., Edge, A. C., & Henry, J. P. 2001, ApJ, 553, 668 [Google Scholar]
- Ebeling, H., Ma, C.-J., & Barrett, E. 2014, A&AS, 211, 21 [Google Scholar]
- Ellison, S. L., Sánchez, S. F., Ibarra-Medel, H., et al. 2018, MNRAS, 474, 2039 [Google Scholar]
- Franchetto, A., Mingozzi, M., Poggianti, B. M., et al. 2021a, ApJ, 923, 28 [NASA ADS] [CrossRef] [Google Scholar]
- Franchetto, A., Tonnesen, S., Poggianti, B. M., et al. 2021b, ApJ, 922, L6 [NASA ADS] [CrossRef] [Google Scholar]
- Fritz, J., Moretti, A., Gullieuszik, M., et al. 2017, ApJ, 848, 132 [NASA ADS] [CrossRef] [Google Scholar]
- Fujita, Y. 2001, ApJ, 550, 612 [NASA ADS] [CrossRef] [Google Scholar]
- Fumagalli, M., Fossati, M., Hau, G. K. T., et al. 2014, MNRAS, 445, 4335 [Google Scholar]
- Giovanelli, R., & Haynes, M. P. 1985, ApJ, 292, 404 [CrossRef] [Google Scholar]
- Göller, J., Joshi, G. D., Rohr, E., Zinger, E., & Pillepich, A. 2023, MNRAS, 525, 3551 [CrossRef] [Google Scholar]
- Gullieuszik, M., Poggianti, B., Moretti, A., et al. 2017, ApJ, 846, 27 [NASA ADS] [CrossRef] [Google Scholar]
- Gullieuszik, M., Poggianti, B. M., McGee, S. L., et al. 2020, ApJ, 899, 13 [Google Scholar]
- Gunn, J. E., & Gott, J. R. 1972, ApJ, 176, 1 [NASA ADS] [CrossRef] [Google Scholar]
- Jáchym, P., Sun, M., Kenney, J. D. P., et al. 2017, ApJ, 839, 114 [Google Scholar]
- Jáchym, P., Kenney, J. D. P., Sun, M., et al. 2019, ApJ, 883, 145 [Google Scholar]
- Kapferer, W., Sluka, C., Schindler, S., Ferrari, C., & Ziegler, B. 2009, A&A, 499, 87 [NASA ADS] [CrossRef] [EDP Sciences] [Google Scholar]
- Kauffmann, G., Heckman, T. M., Tremonti, C., et al. 2003, MNRAS, 346, 1055 [Google Scholar]
- Kennicutt, R. C. 1983, AJ, 88, 483 [NASA ADS] [CrossRef] [Google Scholar]
- Kennicutt, R. C. 1998, ARA&A, 36, 189 [NASA ADS] [CrossRef] [Google Scholar]
- Kennicutt, R. C., Hao, C. N., Calzetti, D., et al. 2009, ApJ, 703, 1672 [NASA ADS] [CrossRef] [Google Scholar]
- Kewley, L. J., Heisler, C. A., Dopita, M. A., & Lumsden, S. 2001, A&AS, 132, 37 [Google Scholar]
- Kodama, T., Smail, I., Nakata, F., Okamura, S., & Bower, R. G. 2001, ApJ, 562, L9 [Google Scholar]
- Kravtsov, A. V., & Borgani, S. 2012, ARA&A, 50, 353 [Google Scholar]
- Kronberger, T., Kapferer, W., Ferrari, C., Unterguggenberger, S., & Schindler, S. 2008, A&A, 481, 337 [NASA ADS] [CrossRef] [EDP Sciences] [Google Scholar]
- Larson, R. B., Tinsley, B. M., & Caldwell, C. N. 1980, ApJ, 237, 692 [Google Scholar]
- Lee, J. H., Lee, M. G., Mun, J. Y., Cho, B. S., & Kang, J. 2022, ApJ, 931, L22 [NASA ADS] [CrossRef] [Google Scholar]
- Lotz, J. M., Koekemoer, A., Coe, D., et al. 2016, ApJ, 837, 97 [Google Scholar]
- McPartland, C., Ebeling, H., Roediger, E., & Blumenthal, K. 2016, MNRAS, 455, 2994 [Google Scholar]
- Moore, B., Katz, N., Lake, G., Dressler, A., & Oemler, A. 1996, Nature, 379, 613 [Google Scholar]
- Moretti, A., Paladino, R., Poggianti, B. M., et al. 2020, ApJ, 897, L30 [Google Scholar]
- Moretti, A., Radovich, M., Poggianti, B. M., et al. 2022, ApJ, 925, 4 [NASA ADS] [CrossRef] [Google Scholar]
- Mostoghiu, R., Knebe, A., Cui, W., et al. 2019, MNRAS, 483, 3390 [NASA ADS] [CrossRef] [Google Scholar]
- Mun, J. Y., Hwang, H. S., Lee, M. G., et al. 2021, J. Korean Astron. Soc., 54, 17 [NASA ADS] [Google Scholar]
- Nelson, D., Pillepich, A., Springel, V., et al. 2019, MNRAS, 490, 3234 [Google Scholar]
- Noeske, K. G., Faber, S. M., Weiner, B. J., et al. 2007a, ApJ, 660, L47 [NASA ADS] [CrossRef] [Google Scholar]
- Noeske, K. G., Weiner, B. J., Faber, S. M., et al. 2007b, ApJ, 660, L43 [CrossRef] [Google Scholar]
- Owers, M. S., Couch, W. J., Nulsen, P. E. J., & Randall, S. W. 2012, ApJ, 750, L23 [Google Scholar]
- Pallero, D., Gómez, F. A., Padilla, N. D., et al. 2019, MNRAS, 488, 847 [NASA ADS] [CrossRef] [Google Scholar]
- Peeters, E., Spoon, H. W. W., & Tielens, A. G. G. M. 2004, ApJ, 613, 986 [NASA ADS] [CrossRef] [Google Scholar]
- Pérez-Millán, D., Fritz, J., González-Lópezlira, R. A., et al. 2023, MNRAS, 521, 1292 [CrossRef] [Google Scholar]
- Pillepich, A., Nelson, D., Springel, V., et al. 2019, MNRAS, 490, 3234 [Google Scholar]
- Pintos-Castro, I., Yee, H. K. C., Muzzin, A., Old, L., & Wilson, G. 2019, ApJ, 876, 40 [Google Scholar]
- Poggianti, B., Fasano, G., Omizzolo, A., et al. 2016, AJ, 151, 78 [NASA ADS] [CrossRef] [Google Scholar]
- Poggianti, B., Moretti, A., Gullieuszik, M., et al. 2017, ApJ, 844, 21 [Google Scholar]
- Poggianti, B., Gullieuszik, M., Tonnesen, S., et al. 2019, MNRAS, 482, 4466 [CrossRef] [Google Scholar]
- Postman, M., Coe, D., Benitez, N., et al. 2012, A&AS, 199, 25 [Google Scholar]
- Ramatsoku, M., Serra, P., Poggianti, B. M., et al. 2020, A&A, 640, A22 [NASA ADS] [CrossRef] [EDP Sciences] [Google Scholar]
- Ramos-Martínez, M., Gómez, G. C., & Pérez-Villegas, A. 2018, MNRAS, 476, 3781 [CrossRef] [Google Scholar]
- Rawle, T. D., Altieri, B., Egami, E., et al. 2014, MNRAS, 442, 196 [Google Scholar]
- Richard, J., Claeyssens, A., Lagattuta, D., et al. 2021, A&A, 646, A83 [EDP Sciences] [Google Scholar]
- Roberts, I. D., Parker, L. C., Roberts, I. D., & Parker, L. C. 2020, MNRAS, 495, 554 [NASA ADS] [CrossRef] [Google Scholar]
- Roberts, I. D., van Weeren, R. J., McGee, S. L., et al. 2021, A&A, 650, A111 [NASA ADS] [CrossRef] [EDP Sciences] [Google Scholar]
- Roberts, I. D., Lang, M., Trotsenko, D., et al. 2022, ApJ, 941, 77 [NASA ADS] [CrossRef] [Google Scholar]
- Roediger, E., Brüggen, M., Owers, M. S., Ebeling, H., & Sun, M. 2014, MNRAS, 443, L114 [Google Scholar]
- Salim, S., Lee, J. C., Janowiecki, S., et al. 2016, ApJ, 227, 2 [NASA ADS] [Google Scholar]
- Schaye, J., Crain, R. A., Bower, R. G., et al. 2015, MNRAS, 446, 521 [Google Scholar]
- Singh, A., Gulati, M., & Bagla, J. S. 2019, MNRAS, 489, 5582 [NASA ADS] [CrossRef] [Google Scholar]
- Steinhauser, D., Schindler, S., & Springel, V. 2016, A&A, 591, A51 [NASA ADS] [CrossRef] [EDP Sciences] [Google Scholar]
- Sun, M., Donahue, M., Roediger, E., et al. 2010, ApJ, 708, 946 [Google Scholar]
- Tonnesen, S., & Bryan, G. L. 2012, MNRAS, 422, 1609 [CrossRef] [Google Scholar]
- Tonnesen, S., Bryan, G. L., van Gorkom, J. H., et al. 2007, ApJ, 671, 1434 [NASA ADS] [CrossRef] [Google Scholar]
- Treu, T., Schmidt, K. B., Brammer, G. B., et al. 2015, ApJ, 812, 114 [Google Scholar]
- Troncoso-Iribarren, P., Padilla, N., Contreras, S., et al. 2016, Galaxies, 4, 77 [NASA ADS] [CrossRef] [Google Scholar]
- Troncoso-Iribarren, P., Padilla, N., Santander, C., et al. 2020, MNRAS, 497, 4145 [Google Scholar]
- Vollmer, B., Cayatte, V., Balkowski, C., & Duschl, W. J. 2001, ApJ, 561, 708 [NASA ADS] [CrossRef] [Google Scholar]
- Vulcani, B., Poggianti, B. M., Finn, R. A., et al. 2010, ApJ, 710, L1 [NASA ADS] [CrossRef] [Google Scholar]
- Vulcani, B., Poggianti, B. M., Gullieuszik, M., et al. 2018, ApJ, 866, L25 [Google Scholar]
- Vulcani, B., Poggianti, B., Moretti, A., et al. 2019, MNRAS, 488, 1597 [NASA ADS] [CrossRef] [Google Scholar]
- Vulcani, B., Fritz, J., Poggianti, B. M., et al. 2020a, ApJ, 892, 146 [Google Scholar]
- Vulcani, B., Poggianti, B. M., Tonnesen, S., et al. 2020b, ApJ, 899, 98 [Google Scholar]
- Vulcani, B., Poggianti, B. M., Gullieuszik, M., et al. 2023a, ApJ, 949, 73 [CrossRef] [Google Scholar]
- Vulcani, B., Treu, T., Calabrò, A., et al. 2023b, ApJ, 948, L14 [NASA ADS] [CrossRef] [Google Scholar]
- Werle, A., Poggianti, B., Moretti, A., et al. 2022, ApJ, 930, 43 [NASA ADS] [CrossRef] [Google Scholar]
- Yagi, M., Komiyama, Y., Yoshida, M., et al. 2007, ApJ, 660, 1209 [Google Scholar]
- Yoon, H., Chung, A., Smith, R., & Jaffé, Y. L. 2017, ApJ, 838, 81 [Google Scholar]
- Zhu, J., Tonnesen, S., & Bryan, G. L. 2024, ApJ, 960, 54 [NASA ADS] [CrossRef] [Google Scholar]
All Tables
All Figures
|
Fig. 1. Characterization of the sample. Mass distribution (left) and disk SSFR (right) of the galaxies in the samples. Vertical lines and shaded areas show the median values with the uncertainties computed as errors on the median. In the right panel, the blue shaded area indicates the region where SFRdisk/M⊙ > 10−11.5 yr−1. |
| In the text | |
|
Fig. 2. Comparison between the star-forming properties of ram-pressure-stripped and undisturbed galaxies. Left: SFR–mass relation for ram-pressure-stripped galaxies (stars) and control sample galaxies (black circles). For ram-pressure-stripped galaxies, filled red symbols refer to the SFR measured within the disk, and empty purple symbols refer to the total SFR (disk+tail). Stars represent ram-pressure-stripped galaxies with ionized tails, and triangles show truncated disks. For each ram-pressure-stripped galaxy, the disk and total SFRs are connected by a line. If no empty star is plotted, this means that the total and disk SFRs are comparable (hence the tail SFR is negligible). The black line and shaded gray regions show the best fit and 1σ uncertainties for the control sample, while the red line and shaded red regions show the best fit and 1σ uncertainties for the ram-pressure-stripped sample when the SFRdisk is considered. The best fit obtained considering the total SFR is not shown for the sake of clarity. Best-fit values are reported in Table 2. The dashed blue region indicates the plane where sSFRdisk < 10−11.5 yr−1. Right: distributions of the differences between the galaxy SFRs and their expected value according to the fit to the control sample, given their mass. Vertical lines and shaded areas show the mean values of the distributions along with uncertainties. Black and gray colors refer to the control sample, and red (purple) colors show the values for the ram-pressure-stripped galaxies when the SFR in the disk (tot) is considered. |
| In the text | |
|
Fig. 3. Logarithmic difference between the total SFR and the disk SFR as a function of stellar mass for ram-pressure-stripped galaxies. Galaxies with a difference of greater than 0.1 dex are labeled. A2744_01, which has SDRdisk = 0, is artificially located at y = 1.5. Error bars are obtained by summing the errors on measurements in quadrature. |
| In the text | |
|
Fig. 4. Spatially resolved SFR–mass relation for galaxies in different regions of the global SFR–mass plane. Top left: enhanced region. Top right: above MS region. Bottom left: below MS region. Bottom left: suppressed region. Small symbols show the distribution of all points regardless of their position on the SFR–mass plane and are reported in all panels. Black points are the spaxels of control sample galaxies, black lines and gray-shaded areas show the control sample best fits along with the scatter, respectively, red stars are the spaxels for RPS galaxies, and red lines and shaded areas show the corresponding best fits and the scatter, respectively. In the suppressed panel, we cannot perform the fit to the RPS points because of their small sample statistics. In all panels, the best fit for the enhanced ram-pressure-stripped line is also reported in red to ease comparisons. The inset of each panel reports the distributions of the differences between the spatially resolved galaxy SFRs and their expected values according to the best fit to the control sample given their spatially resolved mass and considering the galaxies in that SFR–mass region. Vertical lines and shaded areas show the mean values of the distributions along with uncertainties. Black and gray colors refer to the control sample, and red colors show the values for the ram-pressure-stripped galaxies. In each inset, the same distributions and mean values considering all galaxies together are also reported (filled histogram and gray lines refer to the control sample, filled histogram and coral lines to the ram-pressure-stripped sample). |
| In the text | |
Current usage metrics show cumulative count of Article Views (full-text article views including HTML views, PDF and ePub downloads, according to the available data) and Abstracts Views on Vision4Press platform.
Data correspond to usage on the plateform after 2015. The current usage metrics is available 48-96 hours after online publication and is updated daily on week days.
Initial download of the metrics may take a while.