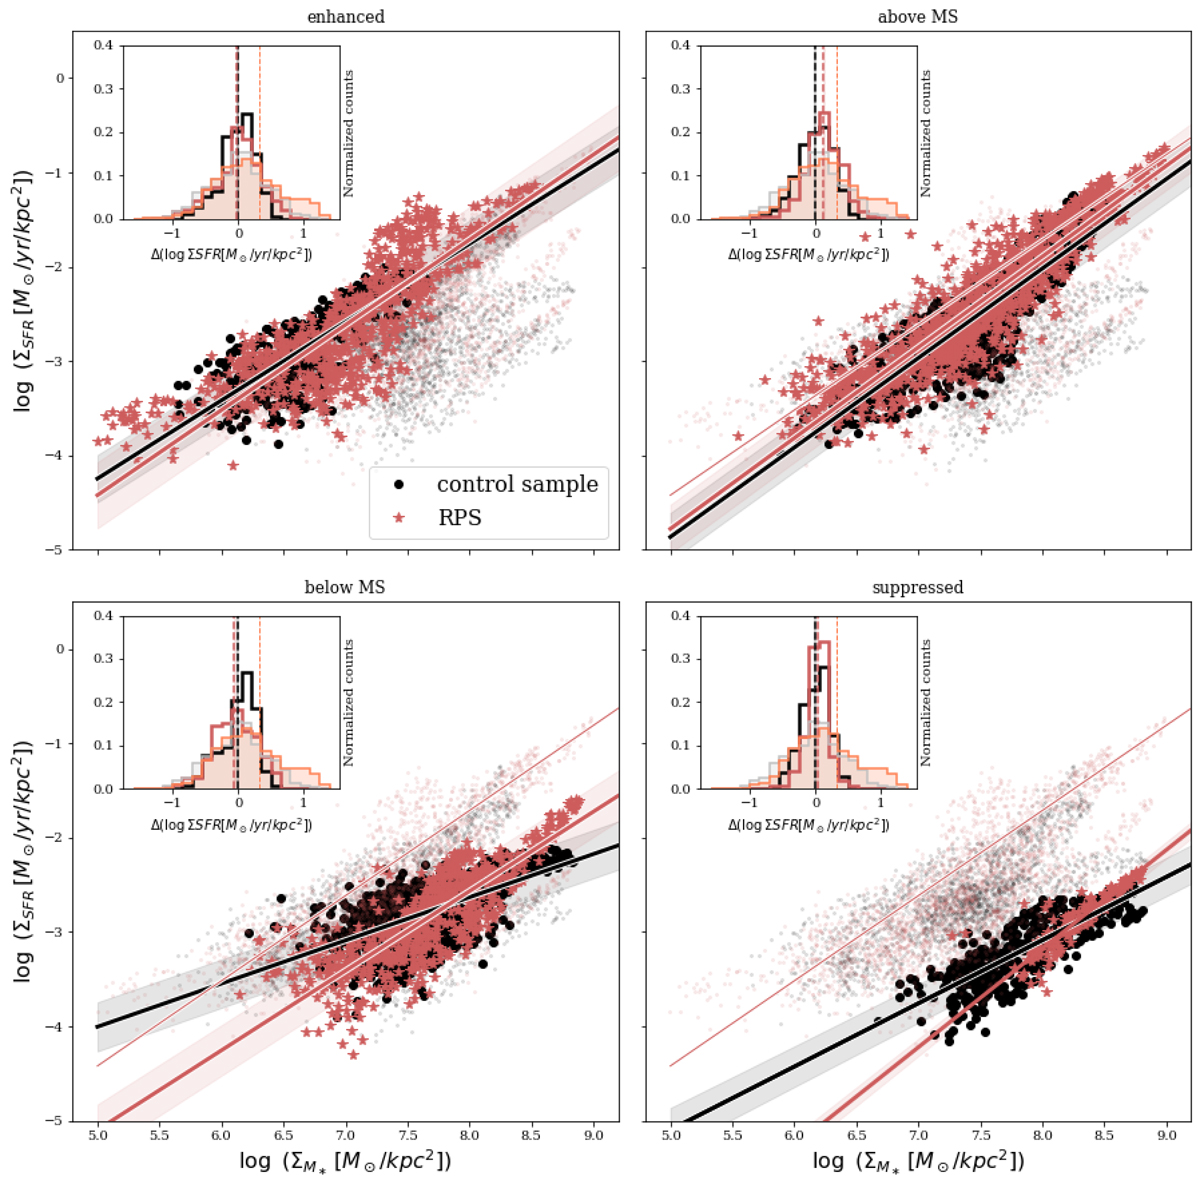
Fig. 4.
Download original image
Spatially resolved SFR–mass relation for galaxies in different regions of the global SFR–mass plane. Top left: enhanced region. Top right: above MS region. Bottom left: below MS region. Bottom left: suppressed region. Small symbols show the distribution of all points regardless of their position on the SFR–mass plane and are reported in all panels. Black points are the spaxels of control sample galaxies, black lines and gray-shaded areas show the control sample best fits along with the scatter, respectively, red stars are the spaxels for RPS galaxies, and red lines and shaded areas show the corresponding best fits and the scatter, respectively. In the suppressed panel, we cannot perform the fit to the RPS points because of their small sample statistics. In all panels, the best fit for the enhanced ram-pressure-stripped line is also reported in red to ease comparisons. The inset of each panel reports the distributions of the differences between the spatially resolved galaxy SFRs and their expected values according to the best fit to the control sample given their spatially resolved mass and considering the galaxies in that SFR–mass region. Vertical lines and shaded areas show the mean values of the distributions along with uncertainties. Black and gray colors refer to the control sample, and red colors show the values for the ram-pressure-stripped galaxies. In each inset, the same distributions and mean values considering all galaxies together are also reported (filled histogram and gray lines refer to the control sample, filled histogram and coral lines to the ram-pressure-stripped sample).
Current usage metrics show cumulative count of Article Views (full-text article views including HTML views, PDF and ePub downloads, according to the available data) and Abstracts Views on Vision4Press platform.
Data correspond to usage on the plateform after 2015. The current usage metrics is available 48-96 hours after online publication and is updated daily on week days.
Initial download of the metrics may take a while.