Fig. 7.
Download original image
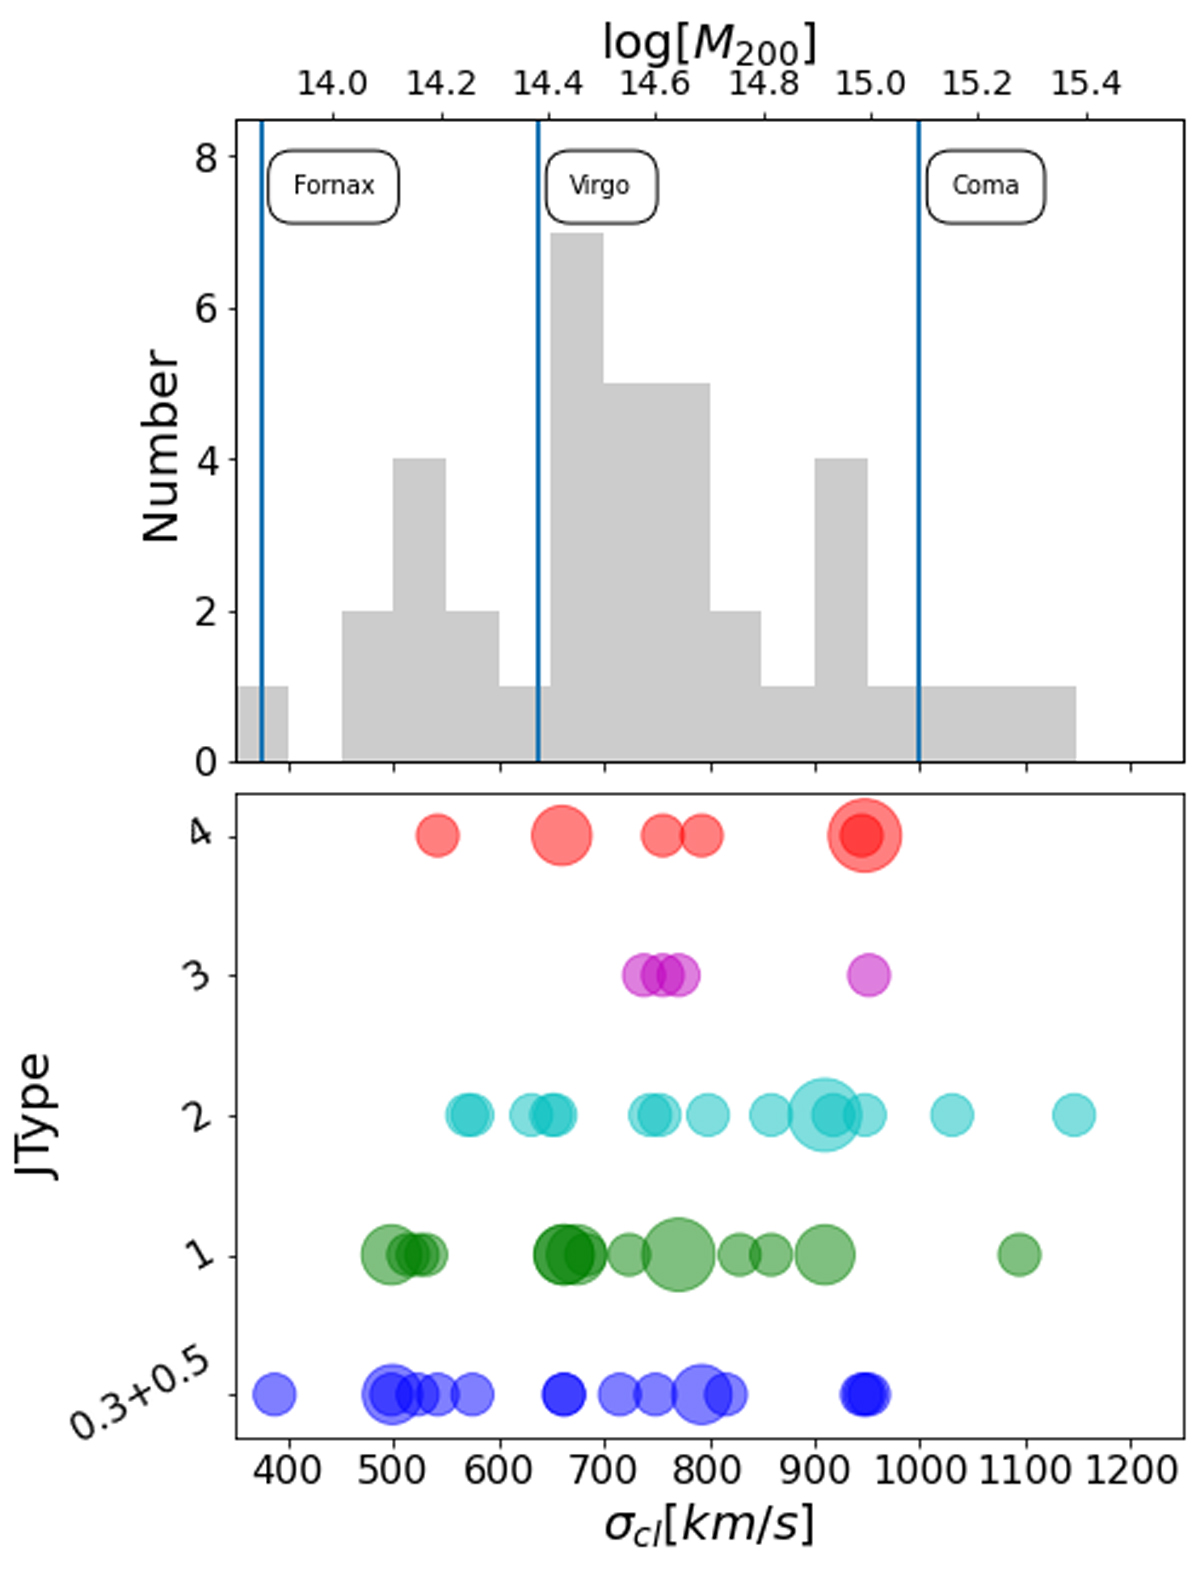
Top: Velocity dispersion distribution of the clusters hosting at least one ram pressure stripped galaxy (JType ≥ 0.3). Cluster masses, computed from the velocity dispersions assuming virialization, are shown in the top axis. The vertical lines show the velocity dispersion of well-studied clusters in the local Universe (from left to right: Fornax, Virgo, and Coma). Bottom: Frequency of galaxies of different JTypes as a function of the velocity dispersion of the hosting cluster. The symbol size is proportional to the frequency.
Current usage metrics show cumulative count of Article Views (full-text article views including HTML views, PDF and ePub downloads, according to the available data) and Abstracts Views on Vision4Press platform.
Data correspond to usage on the plateform after 2015. The current usage metrics is available 48-96 hours after online publication and is updated daily on week days.
Initial download of the metrics may take a while.