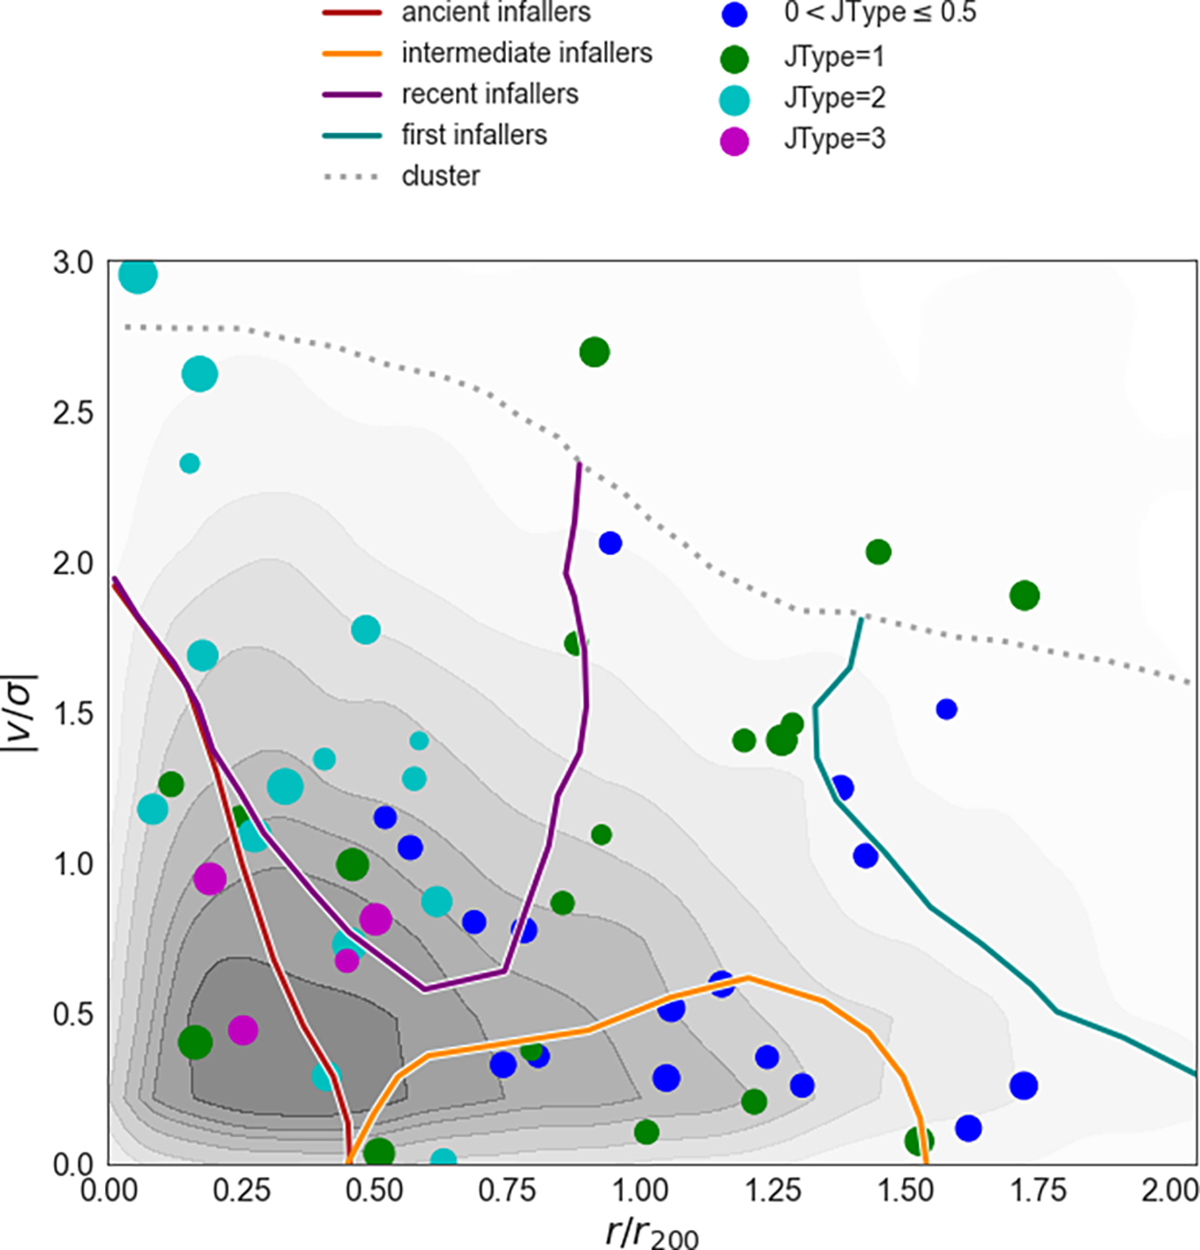
Fig. 6.
Download original image
Stripping types distributed across the projected phase space diagram, as indicated in the legend. Overplotted are colored lines that delimit the regions defined by Rhee et al. (2017): first (not fallen yet; turquoise), recent (0<tinfall<3.63 Gyr; purple), intermediate (3.63<tinfall<6.45 Gyr; yellow), and ancient (6.45<tinfall<13.7 Gyr; red) infallers. The dashed line indicates the limit of subhalos, in order to define galaxies bounded to the clusters. The size of the circles is proportional to the galaxy stellar mass, and masses are given in Table A.1. The gray contours in the background represent the density of points from all spectroscopic cluster members in the WINGS/OmegaWINGS sample. The control sample galaxies are not shown here.
Current usage metrics show cumulative count of Article Views (full-text article views including HTML views, PDF and ePub downloads, according to the available data) and Abstracts Views on Vision4Press platform.
Data correspond to usage on the plateform after 2015. The current usage metrics is available 48-96 hours after online publication and is updated daily on week days.
Initial download of the metrics may take a while.