| Issue |
A&A
Volume 699, July 2025
|
|
|---|---|---|
| Article Number | A321 | |
| Number of page(s) | 7 | |
| Section | Stellar structure and evolution | |
| DOI | https://doi.org/10.1051/0004-6361/202554185 | |
| Published online | 16 July 2025 | |
Spectroscopic orbit and variability of the Be star V1624 Cyg = 28 Cyg⋆
1
Astronomical Institute of Charles University, Faculty of Mathematics and Physics, V Holešovičkách 2, CZ-180 00 Praha 8 – Troja, Czech Republic
2
Physics & Astronomy Department, University of Victoria, PO Box 3055 STN CSC Victoria, BC V8W 3P6, Canada
3
Astronomical Institute, Czech Academy of Sciences, CZ-251 65 Ondřejov, Czech Republic
4
LIRA, Observatoire de Paris, Université PSL, CNRS, Sorbonne Université, Université Paris Cité, CY Cergy Paris Université, 5 place Jules Janssen, 92195 Meudon, France
5
Hvar Observatory, Faculty of Geodesy, University of Zagreb, Kačićeva 26, 10000 Zagreb, Croatia
6
Astronomy and Space Sci. Dept., Science Faculty, Erciyes University, 38039 Kayseri, Türkiye
⋆⋆ Corresponding author: This email address is being protected from spambots. You need JavaScript enabled to view it.
Received:
19
February
2025
Accepted:
19
May
2025
Abstract
In recent years the idea, first formulated many decades ago, that the Be phenomenon could be causally related to the duplicity of Be stars, has been repeatedly reconsidered from various perspectives. It is important, therefore, to have reliable information on Be stars, which are confirmed members of binary systems. This study is devoted to V1624 Cyg = 28 Cygni, which was recently identified as a binary with a compact secondary. By measuring the radial velocities (RVs) of the wings of the H alpha emission line and using archival data and published RVs from the International Ultraviolet Explorer, we demonstrate that the Be primary moves in the 359.d26 orbit found recently from interferometry. Our preliminary radial-velocity solution leads to binary masses of 5.6 M⊙, and 0.66 M⊙. Moreover, we documented large and irregular spectral, brightness, and colour changes over a time interval of several decades to show that the object never completely lost its circumstellar matter.
Key words: binaries: spectroscopic / stars: emission-line / Be / stars: fundamental parameters / stars: individual: V1624 Cyg
Based on new spectroscopic observations from the CCD coudé spectrograph of the Dominion Astrophysical Observatory; on the CCD coudé spectra from the Ondřejov Observatory, and amateur spectra from the BeSS database.
© The Authors 2025
 Open Access article, published by EDP Sciences, under the terms of the Creative Commons Attribution License (https://creativecommons.org/licenses/by/4.0), which permits unrestricted use, distribution, and reproduction in any medium, provided the original work is properly cited.
This article is published in open access under the Subscribe to Open model. This email address is being protected from spambots. You need JavaScript enabled to view it. to support open access publication.
1. Introduction
The bright B2-B3e star V1624 Cyg (also known as 28 Cyg, HD 191610, HR 7708, BD+36°3907, HIP 99303, and MWC 329; α2000.0 = 20h09m25.s619, δ2000.0 = +36°50′22 64) has been the subject of numerous studies, especially since it was discovered to exhibit rapid light and line-profile changes. We refer readers to the paper by Pavlovski et al. (1997), where the first of these studies are summarized in detail, and to the very detailed investigation by Baade et al. (2018), which is mainly based on space photometries and amateur Hα spectra from the Be Star Spectra (BeSS) database (Neiner et al. 2011). Hvar UBV photometry reported by Pavlovski et al. (1997) shows the range of rapid V magnitude variations from about 4m.9 to 5m.0 over the time interval from JD 2446235 to 2447791, with no obvious secular change, and mild long-term changes in both B − V and U − B indices. Baade et al. (2018) report long-term changes in the emission-line strength. Curtiss (1925) reported cyclic variations of the emission with a cycle of 1373 days, which later faded away. These studies show that, like many other early-type Be stars, V1624 Cyg exhibits a complex set of variabilities, both rooted in the star itself and its circumstellar disc.
Losh (1932) analysed a collection of 205 photographic spectra from Ann Arbor Observatory and measured Balmer Hβ and Hγ lines. She published the mean radial velocities (RVs) of the absorption-line cores and the emission-line wings. She concluded that the star is probably a spectroscopic binary with a 226 0 orbital period and an orbit with an eccentricity of 0.746 and a semi-amplitude of 12.2 km s−1. She noted, however, that the RVs are also modulated by two other periodicities of 45
 33, and 1
 51775. Moreover, she further studied the changes in the emission strength and also noted long-term RV changes in the early observations. For that reason, she excluded these early RVs from the period analysis and tabulated them separately. Her period analysis is thus based on 189 RVs. In a study aimed to establish a fraction of binaries among bright B and Be stars, Abt & Levy (1978) concluded that V1624 Cyg has a constant radial velocity (RV) of −36.9 ± 8.4 km s−1. They published 25 individual RVs covering a time interval over 700 days. Individual RVs have a range from −11 to −54 km s−1. Becker et al. (2015) published the mean RV of V1624 Cyg derived from the high-resolution echelle spectrograph (HIRES) attached to the Keck I reflector: −1.98 ± 11.46 km s−1. They noted that the large rms of the mean indicates some variability. They calibrated the wavelength scale of the HIRES spectrograph with the iodine gas cell and derived the RVs using a rather complicated fit of the observed spectra over a large interval of wavelengths to a template spectrum chosen from the grid of PHOENIX models (see Sect. 2 of their paper for details.) Wang et al. (2018) searched for new hot sub-dwarf companions to Be stars in the International Ultraviolet Explorer (IUE) spectra using the cross-correlation (CCF) technique. Their search for V1624 Cyg gave marginal detections in only a part of the available IUE spectra and they tabulated 25 RVs of the possible sub-dwarf companion. Later, however, Wang et al. (2021) investigated high-quality far-UV spectra from the Imaging Spectrograph of the Hubble Space Telescope (HST/STIS), again using the CCF technique, and were unable to find a trace of a hot compact secondary. They only published three RVs of the Be star secured over an interval of 35 days, all close to −25 km s−1. Klement et al. (2022), maybe unaware of the Losh (1932) study, claim that no evidence of a spectroscopic orbit is available in the literature. Using the Gaia distance and indirect arguments, they estimated the probable orbital period at a value of 246 d, close to the Losh (1932) result. Klement et al. (2024) obtain 12 good interferometric observations covering an interval of 457 days and conclude that V1624 Cyg is an astrometric and spectroscopic binary with a 359
 26 ± 0
 041 period and a circular orbit. Their interferometry covers about one half of the 359 d orbit.
Since this latest value of the orbital period is very close to one tropical year, which is a bit suspect, and considering the general importance of this object, we decided to carry out a new detailed study based on the numerous spectra available to us and on published RVs and spectrophotometric measurements. Our goals are (i) to measure the emission and absorption RVs and to find the true period of RV changes, and (ii) to document the time variability of the object over a long time interval. A detailed study of rapid spectral and brightness changes, also based on Transiting Exoplanets Survey Satellite (TESS) photometry, will be the subject of another study.
2. Observations and data reductions
2.1. Spectroscopy
We carefully reduced numerous red electronic spectra from several observatories, also including a selection of BeSS amateur spectra (Neiner et al. 2011), which had spectral resolutions better than 11 000, and we measured the Hα and He I 6678 RVs using the latest version 2 of the program reSPEFO1 and comparing the direct and flipped line profiles on the computer screen. To have some idea of the uncertainties in the settings on the lines, which were affected by either the presence of numerous telluric lines or noise, all RVs were independently measured twice by Petr Harmanec and Pavel Doležal, and the mean values were adopted. A record of all the spectra used is provided in Table 1.
Journal of electronic spectra.
Additionally, we collected (and digitized when necessary) the existing published RVs with known times of observation. An overview of this is provided in Table 2. All individual RVs and their heliocentric Julian dates (HJDs) adopted from the literature are in Table 3, and the RVs measured in the electronic spectra by us are in Table 4. Both these tables are only available at the Strasbourg astronomical data centre (CDS).
Journal of published RVs.
2.2. Photometry
In the past, V1624 Cyg was monitored in a carefully calibrated stardard UBV system at Hvar, but regrettably this has not happened in recent years. We resumed observations in 2024, using the UBVR photometry. Additionally, we transformed the existing Hipparcos Hp observations with flags 0 and 1 to Johnson V magnitude after Harmanec (1998), and we compiled existing photometric observations with known dates of observation, which had been obtained in the Johnson UBV system or could be transformed to it. They are summarized in Table 5 and published individually in Table 6. This table is also only available at the CDS.
Journal of available photometry with known dates of observation.
3. Mapping the timescales of variations
First we wanted to see how the known rapid spectral and brightness variations affect our RV measurements of the steep emission wings and absortion core of Hα. To this end, we selected two dense series of observations, from the Dominion Astrophysical Observatory (DAO) and the network of robotic echelle spectrographs (NRES) and plotted the measured RVs versus time, see Fig. 1. One can see that the RVs are indeed affected by rapid changes and there is some tendency to anti-correlation between emission and absorption RVs.
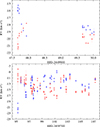 |
Fig. 1. Evidence of rapid RV variations in the Hα line measured in two dense night series of spectra. RVs of the emission wings are denoted by red circles, and those of the absorption core by blue circles. The error bars of individual RVs are shown. Top: A series of DAO spectra. Bottom: A series of NRES spectra. |
In Fig. 2 we show the V/R changes of the double Hα emission for the same two night series of spectra. It seems probable that the measured RVs were partly affected by these line-profile changes. We note that similar rapid changes were reported by Bossi et al. (1993), who reconciled them with a period of 0 7564. We also note that the NRES cadence was high specifically because the rapid variations of the Hα emission were observed during an active mass ejection phase studied by Labadie-Bartz et al. (2025). One of the main conclusions of their paper is that, in all observed cases, Be emission lines always exhibit rapid asymmetry oscillations with a characteristic frequency during and/or shortly after the mass ejection episodes, which would likewise also manifest in RV variations when using the emission wing mirror method.
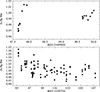 |
Fig. 2. Evidence of rapid V/R variations in the Hα line measured in two dense night series of spectra. Top: A series of DAO spectra. Bottom: A series of NRES spectra. |
4. Long-term variability of V1624 Cyg
When we compiled the available spectrophotometric and photometric observations of V1624 Cyg, it became evident that V1624 Cyg has been undergoing irregular long-term cyclic changes in several observables. This finding is in agreement with previous studies.
Figure 3 shows the dramatic changes in the equivalent width of the Hα line with time. In contrast to some other Be stars, it seems that V1624 Cyg has never been observed in a purely absorption phase. Losh (1932) discussed evidence for an episode of long-term V/R and line intensity changes of the Balmer lines for Julian dates (JDs) prior to 2420000. Even near the equivalent-width minimum around JD 2455000-2456000, a double Hα emission was clearly present (see the bottom panel of Fig. 4).
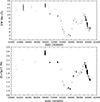 |
Fig. 3. Recorded secular changes of the equivalent width (upper panel) and the peak intensity (bottom panel) of the Hα line. The black dots are our measurements in electronic spectra, smaller symbols denote the BeSS amateur spectra, open circles are measurements adopted from the papers of Slettebak & Reynolds (1978), Fontaine et al. (1982), Andrillat (1983), Tarasov & Shcherbakov (1986), Doazan et al. (1991), Slettebak et al. (1992), Bossi et al. (1993), Grundstrom (2007), Hesselbach (2009), Jones et al. (2011), and Baade et al. (2018). |
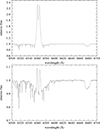 |
Fig. 4. Parts of the Ondřejov red spectra taken on HJD 2452844.3888, when the Hα emission was close to its maximum strength (top panel), and on HJD 2455814.3065, i.e. near the deepest minimum of all recorded equivalent width measurements (bottom). We see that the double Hα emission is still clearly present there. |
In Fig. 5 we show a plot of all RVs for the data at our disposal, separate for the absoption RVs, and for Balmer emission RVs. Here, the evidence of secular changes is less obvious and can only be suspected for the observations before JD 2421000, as already noted by Losh (1932). It must also be kept in mind that the available material is somewhat heterogenous. Losh (1932) RVs are based on the mean of Balmer Hβ and Hγ RVs, the RVs by Abt & Levy (1978) are mean RVs of a number of Balmer and He I from photographic spectra (RVs around JD 2442000), the RVs by Grundstrom (2007) are tabulated for Balmer line cores and He I lines, the RVs from the Keck I telescope are cross-correlation RVs, and all our RVs are measured from Hα line profiles.
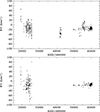 |
Fig. 5. Time plot of all RVs at our disposal. Absorption RVs are shown in the upper plot, RVs of Hα emission wings are shown in the bottom plot. |
Finally, in Fig. 6 we plot the available records of the brightness and colour changes based on observations obtained in, or transformed to, the Johnson UBV system. Besides obvious rapid changes, one can see mild secular changes, possibly correlated with the long-term spectral variations. Regrettably, observations from the interval of JD 2454000-2455000, when the Balmer emission was weak, are missing.
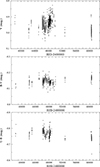 |
Fig. 6. Recorded brightness and colour changes based on observations secured in, or transformed to, the Johnson UBV system. |
5. Towards orbital solution
It is our experience that the RVs measured on the steep emission-line wings (see two samples of the Hα line profiles in Fig. 4) usually provide the most realistic orbital RV curve for the Be components of binary stars (see the detailed justification in Ruždjak et al. 2009). Having a compilation of such emission-line velocities and also a larger but rather heterogeneous set of absorption RVs, we subjected both sets to period analyses with a program based on the Deeming (1975) method, which derives amplitude periodograms. In doing so, we excluded early Ann Arbor RVs secured before JD 2420000, which are affected by long-term changes [see the discussion in][and Fig. 5 here]losh32. Since the shortest period identified by Baade et al. (2018) in several sets of photometric observations was about 0 31, we carried out the period searches in the interval from 0
 31 to 500
 0, with a frequency step of 0.1/△ T, where △ T denotes the time interval covered by observations. Besides the one-day and two-day aliases of the long period, no significant rapid periods were detected. For both datasets, the two highest peaks in theperiodograms were close to 355–360 d and 236 d. For the emission-line RVs, the best period was very close to the 359
 26 period found by Klement et al. (2024) from interferometry. The amplitude periodograms are shown in Fig. 7.
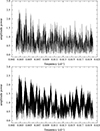 |
Fig. 7. Amplitude periodograms of all RVs without early data from Losh (1932). Top: Absorption RVs. Bottom: Hα emission-line wings RVs. The frequency of the orbital period of 359 |

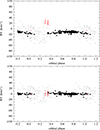 |
Fig. 8. Radial-velocity curve for the final solution (top panel) and the O − C residuals from it (bottom panel). RVs are emission-line RVs, the mean of Hβ and Hγ from the Ann Arbor photographic spectra by Losh (1932) (shown by pluses), and Hα emission wings for all CCD spectra (shown as black circles). The IUE spectra of the compact secondary, published by Wang et al. (2018), are shown by red circles. |
We then derived several trial orbital solutions using program FOTEL (Hadrava 1990, 2004). For the emission RVs, this led to reasonable solutions that supported the orbit derived by Klement et al. (2024). However, it turned out that for some of the Ann Arbor photographic RVs, based on Hβ and Hγ emission-wing velocities, the O − C residuals were quite high. We suspect that this happened in cases when one of the emission peaks of the double emission lines was stronger and the setting was made on it instead of on the wings of the whole line. As a precaution, we omitted 12 such RVs, which had residuals larger than 40 km s−1, from the solution. In all cases, with one exception, these measurements were based on only one Balmer line. We list the JDs of these omitted RVs in Table 7. We then calculated two other orbital solutions: solution 1, in which the orbital period and epoch of superior conjunction were fixed at values from the accurate interferometric solution by Klement et al. (2024), and solution 2, where we allowed for the convergency of these elements. To obtain the estimate of the mass ratio as well, we included 25 RVs from the IUE, reconstructed by Wang et al. (2018). Both these solutions are listed in Table 8. We underline that a solution based on all Ann Arbor spectra has naturally larger rms errors, but the elements are quite similar to those of solution 1. We note that we allowed for different systemic velocities for the CCD, IUE, and Ann Arbor photographic spectra since they can have different zero points of the velocity scale. All CCD spectra were assigned the same systemic velocity since their RV zero point was checked through the RV measurements of a selection of telluric lines. It is encouraging that the systemic velocities of CCD and Ann Arbor spectra agree within their estimated errors. This increases the credibility of the solutions. As Fig. 8 shows, available RVs from electronic spectra do not cover the RV minimum and the orbital solution based solely on them leads to a significantly lower semi-amplitude of the velocity curve. This is the reason why we currently prefer the solutions based on all available emission-line RVs. For a final, fully reliable orbit of the Be primary, continuing spectral observations in phases of strong Balmer Hα emission are needed. Finally, we mention that a solution for all absorption-line RVs leads to an orbital period and epoch that are quite similar to those of solution 2.
Ann Arbor emission-line RVs with the O − C residuals larger than 40 km s−1, omitted from the final orbital solution.
Orbital solutions based on the Hα emission RVs.
We also tried to recompute the elements of the interferometric orbit using an independent program for such a solution (Zasche & Wolf 2007). Given the limited number of only 12 observations, we arrived at very similar solutions to those presented in Table 8. Only with a higher number of precise interferometric observations would it be possible to discriminate between the two solutions of Table 8.
At the suggestion of an anonymous referee, we tried to check whether a reasonable orbital solution could be obtained for absorption RVs from a subset of electronic spectra with high spectral resolutions, i.e. NRES and KECK spectra. The trouble is that while the NRES spectra, based on the measurements of the Hα absorption core in reSPEFO, cover only a limited phase interval of the 359 d orbital period, the KECK RVs, based on a comparison of observed spectra with the synthetic spectra over a large interval of wavelengths, are dominated by rapid RV changes and do not give a reasonable RV curve for the orbital period. A period search in these RVs and a consecutive sinusoidal fit returned a period of 1 84290(12), which is close to a one-day alias of the period of 0
 6474 (frequency 1.5447 c d−1), one of the dominant periods found by Baade et al. (2018) in their period analyses of several satellite photometries of V1624 Cyg. A corresponding phase plot is shown in Figure 9. No orbital signal is obvious, even in the residuals from the fit of the 1
 84 period.
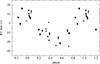 |
Fig. 9. Phase diagram of Keck RVs plotted for the ephemeris |

6. Discussion
When we provisionally take solution 1 as the final one, and assume an orbital inclination i = 61.°3 after Klement et al. (2024), we obtain the binary masses of m1 = 5.6 M⊙ and m2 = 0.66 M⊙. Zorec et al. (2016) attempted to estimate the fundamental parameters of a group of Be stars. For V1624 Cyg, they obtained Teff = 23830 ± 930 K and the inclination of the rotatonal axis estimated from the gravity darkening as 69° ±17°. Within the limits of the respective errors, it seems that the orbital and rotational axes are aligned. The above value of Teff would correspond to a primary mass of about 9 M⊙ according to Harmanec (1988). On the other hand, the Be primary was often classified as B3V and the mass of 5.6 M⊙ is then acceptable according to tabulation by Harmanec (1988). The total mass we obtained is slightly lower than that obtained by Klement et al. (2024). These authors derived the total mass using the IUE RVs of the secondary from Wang et al. (2018) and the Gaia distance, which, however, was not yet corrected for the effect of the 359 d orbit. Moreover, if one takes the estimated errors of K1 and K1/K2 of our solution 1 into account, the two results agree within the error limits. To obtain an accurate determination of both binary masses, not only continuing Hα spectra of the primary but also new far-UV spectra of the secondary will be needed. It is not quite clear why Wang et al. (2021) were unable to detect the lines of the secondary in the good HST/STIS far-UV spectra taken near one of the elongations. They tentatively suggested that some kind of temporal variability makes the detection of the secondary more favourable at certain epochsonly.
We note that the orbital period of V1624 Cyg is one of the longest orbital periods yet confirmed for a Be binary with a post-mass-transfer companion. The inspection of a catalogue of binaries with hot components and Balmer emission lines by Harmanec (2001) shows that only rather exotic objects like symbiotic stars have longer orbital periods. One system that bears some similarity is KS Per = HD 30353, with a 362 8 period and a hot sub-dwarf companion.
This underscores the importance of long-term monitoring of Be stars. With such a small semi-amplitude of only ∼5 km s−1, and Porb ∼1 yr, confirming binaries such as V1624 Cyg, and perhaps any yet-undiscovered even longer-period Be binaries, requires long time series of high-quality data and careful analysis. It is likewise important to inspect older literature records. These often contain valuable insights, even if the at-the-time interpretation has changed. That we are only recently coming to understand the binary properties of such a bright and well-studied star as V1624 Cyg suggests that we are still exploring the ‘tip of the iceberg’ of the Bepopulation.
Data availability
Tables 3, 4, and 6 are available at the CDS via anonymous ftp to cdsarc.cds.unistra.fr (130.79.128.5) or via https://cdsarc.cds.unistra.fr/viz-bin/cat/J/A+A/699/A321
Acknowledgments
We gratefully acknowledge the use of the latest publicly available version of the program FOTEL, written by P. Hadrava. We also acknowledge the use of the reduction program for spectroscopic reductions reSPEFO, written by A. Harmanec. Our sincere thanks go to J.C. Becker and A. Vanderburg, who kindly provided us with their individual RV measurements of V1624 Cyg from the Keck I telescope spectra, and to J.R. Percy, who put his photoelectric observations at our disposal. Recommendations by an anonymous referee improved the clarity of this study. Over the years, this long-term project was supported by the grants 205/06/0304, 205/08/H005, P209/10/0715, and GA15-02112S of the Czech Science Foundation, by the grants 678212 and 250015 of the Grant Agency of the Charles University in Prague, from the research project AV0Z10030501 of the Academy of Sciences of the Czech Republic, and from the Research Program MSM0021620860 Physical study of objects and processes in the solar system and in astrophysics of the Ministry of Education of the Czech Republic. The research of PK was supported by the ESA PECS grant 98058. HB acknowledges financial support from the Croatian Science Foundation under the project 6212 “Solar and Stellar Variability”. We used some spectra of the BeSS database, operated at LESIA, Observatoire de Meudon, France: http://basebe.obspm.fr. Finally, we acknowledge the use of the electronic database from the CDS, Strasbourg, and the electronic bibliography maintained by the NASA/ADS system.
References
- Abt, H. A., & Levy, S. G. 1978, ApJS, 36, 241 [Google Scholar]
- Adelman, S. J., & Lovelace, C. A. 1997, J. Astron. Data, 3, 6 [Google Scholar]
- Andrillat, Y. 1983, A&AS, 53, 319 [NASA ADS] [Google Scholar]
- Baade, D., Pigulski, A., Rivinius, T., et al. 2018, A&A, 610, A70 [NASA ADS] [CrossRef] [EDP Sciences] [Google Scholar]
- Becker, J. C., Johnson, J. A., Vanderburg, A., & Morton, T. D. 2015, ApJS, 217, 29 [NASA ADS] [CrossRef] [Google Scholar]
- Bossi, M., Guerrero, G., & Zanin, F. 1993, A&A, 269, 343 [NASA ADS] [Google Scholar]
- Curtiss, R. H. 1925, Popul. Astron., 33, 537 [Google Scholar]
- Deeming, T. J. 1975, Ap&SS, 36, 137 [Google Scholar]
- Doazan, V., Sedmak, G., Barylak, M., Rusconi, L., & Battrick, B. 1991, ESA Spec. Publ., 1147 [Google Scholar]
- Fontaine, G., Villeneuve, B., Landstreet, J. D., & Taylor, R. H. 1982, ApJS, 49, 259 [Google Scholar]
- Grundstrom, E. D. 2007, Ph.D. Thesis, Georgia State University, USA [Google Scholar]
- Hadrava, P. 1990, Contr. Astron. Obs. Skalnaté Pleso, 20, 23 [Google Scholar]
- Hadrava, P. 2004, Publ. Astron. Inst. Acad. Sci. Czech Rep., 92, 1 [Google Scholar]
- Harmanec, P. 1988, BAICz, 39, 329 [Google Scholar]
- Harmanec, P. 1998, A&A, 335, 173 [NASA ADS] [Google Scholar]
- Harmanec, P. 2001, Publ. Astron. Inst. Czechoslovak Acad. Sci., 89, 9 [Google Scholar]
- Harmanec, P., & Božić, H. 2001, A&A, 369, 1140 [NASA ADS] [CrossRef] [EDP Sciences] [Google Scholar]
- Hesselbach, E. N. 2009, Ph.D. Thesis, University of Toledo, Ohio, USA [Google Scholar]
- Johnson, H. L., Iriarte, B., Mitchell, R. I., & Wisniewski, W. Z. 1966, Commun. Lunar Planet. Lab., 4, 99 [NASA ADS] [Google Scholar]
- Jones, C. E., Tycner, C., & Smith, A. D. 2011, AJ, 141, 150 [Google Scholar]
- Klement, R., Schaefer, G. H., Gies, D. R., et al. 2022, ApJ, 926, 213 [NASA ADS] [CrossRef] [Google Scholar]
- Klement, R., Rivinius, T., Gies, D. R., et al. 2024, ApJ, 962, 70 [NASA ADS] [CrossRef] [Google Scholar]
- Labadie-Bartz, J., Carciofi, A. C., Rubio, A. C., et al. 2025, A&A, 699, A82 [NASA ADS] [CrossRef] [EDP Sciences] [Google Scholar]
- Losh, H. M. 1932, Publ. Mich. Obs., 4, 199 [Google Scholar]
- Neiner, C., de Batz, B., Cochard, F., et al. 2011, AJ, 142, 149 [Google Scholar]
- Pavlovski, K., Harmanec, P., Božić, H., et al. 1997, A&AS, 125, 75 [NASA ADS] [CrossRef] [EDP Sciences] [Google Scholar]
- Percy, J. R., Harlow, J., Hayhoe, K. A. W., et al. 1997, PASP, 109, 1215 [Google Scholar]
- Perryman, M. A. C., & ESA 1997, in The HIPPARCOS and TYCHO catalogues, Astrometric and photometric star catalogues derived from the ESA Hipparcos Space Astrometry Mission (Noordwijk, Netherlands: ESA Publications) [Google Scholar]
- Ruždjak, D., Božić, H., Harmanec, P., et al. 2009, A&A, 506, 1319 [NASA ADS] [CrossRef] [EDP Sciences] [Google Scholar]
- Seeds, M. A. 1992, ASP Conf. Ser., 28, 17 [Google Scholar]
- Slettebak, A., & Reynolds, R. C. 1978, ApJS, 38, 205 [Google Scholar]
- Slettebak, A., Collins, G. W., & Truax, R. 1992, ApJS, 81, 335 [NASA ADS] [CrossRef] [Google Scholar]
- Tarasov, A. E., & Shcherbakov, A. G. 1986, Izv. Krym Astrofiz. Obs., 74, 19 [Google Scholar]
- Wang, L., Gies, D. R., & Peters, G. J. 2018, ApJ, 853, 156 [Google Scholar]
- Wang, L., Gies, D. R., Peters, G. J., et al. 2021, AJ, 161, 248 [Google Scholar]
- Zasche, P., & Wolf, M. 2007, Astron. Nachr., 328, 928 [Google Scholar]
- Zorec, J., Frémat, Y., Domiciano de Souza, A., et al. 2016, A&A, 595, A132 [NASA ADS] [CrossRef] [EDP Sciences] [Google Scholar]
All Tables
Ann Arbor emission-line RVs with the O − C residuals larger than 40 km s−1, omitted from the final orbital solution.
All Figures
|
Fig. 1. Evidence of rapid RV variations in the Hα line measured in two dense night series of spectra. RVs of the emission wings are denoted by red circles, and those of the absorption core by blue circles. The error bars of individual RVs are shown. Top: A series of DAO spectra. Bottom: A series of NRES spectra. |
| In the text | |
|
Fig. 2. Evidence of rapid V/R variations in the Hα line measured in two dense night series of spectra. Top: A series of DAO spectra. Bottom: A series of NRES spectra. |
| In the text | |
|
Fig. 3. Recorded secular changes of the equivalent width (upper panel) and the peak intensity (bottom panel) of the Hα line. The black dots are our measurements in electronic spectra, smaller symbols denote the BeSS amateur spectra, open circles are measurements adopted from the papers of Slettebak & Reynolds (1978), Fontaine et al. (1982), Andrillat (1983), Tarasov & Shcherbakov (1986), Doazan et al. (1991), Slettebak et al. (1992), Bossi et al. (1993), Grundstrom (2007), Hesselbach (2009), Jones et al. (2011), and Baade et al. (2018). |
| In the text | |
|
Fig. 4. Parts of the Ondřejov red spectra taken on HJD 2452844.3888, when the Hα emission was close to its maximum strength (top panel), and on HJD 2455814.3065, i.e. near the deepest minimum of all recorded equivalent width measurements (bottom). We see that the double Hα emission is still clearly present there. |
| In the text | |
|
Fig. 5. Time plot of all RVs at our disposal. Absorption RVs are shown in the upper plot, RVs of Hα emission wings are shown in the bottom plot. |
| In the text | |
|
Fig. 6. Recorded brightness and colour changes based on observations secured in, or transformed to, the Johnson UBV system. |
| In the text | |
|
Fig. 7. Amplitude periodograms of all RVs without early data from Losh (1932). Top: Absorption RVs. Bottom: Hα emission-line wings RVs. The frequency of the orbital period of 359 |
| In the text | |
|
Fig. 8. Radial-velocity curve for the final solution (top panel) and the O − C residuals from it (bottom panel). RVs are emission-line RVs, the mean of Hβ and Hγ from the Ann Arbor photographic spectra by Losh (1932) (shown by pluses), and Hα emission wings for all CCD spectra (shown as black circles). The IUE spectra of the compact secondary, published by Wang et al. (2018), are shown by red circles. |
| In the text | |
|
Fig. 9. Phase diagram of Keck RVs plotted for the ephemeris |
| In the text | |
Current usage metrics show cumulative count of Article Views (full-text article views including HTML views, PDF and ePub downloads, according to the available data) and Abstracts Views on Vision4Press platform.
Data correspond to usage on the plateform after 2015. The current usage metrics is available 48-96 hours after online publication and is updated daily on week days.
Initial download of the metrics may take a while.