Open Access
Fig. 1.
Download original image
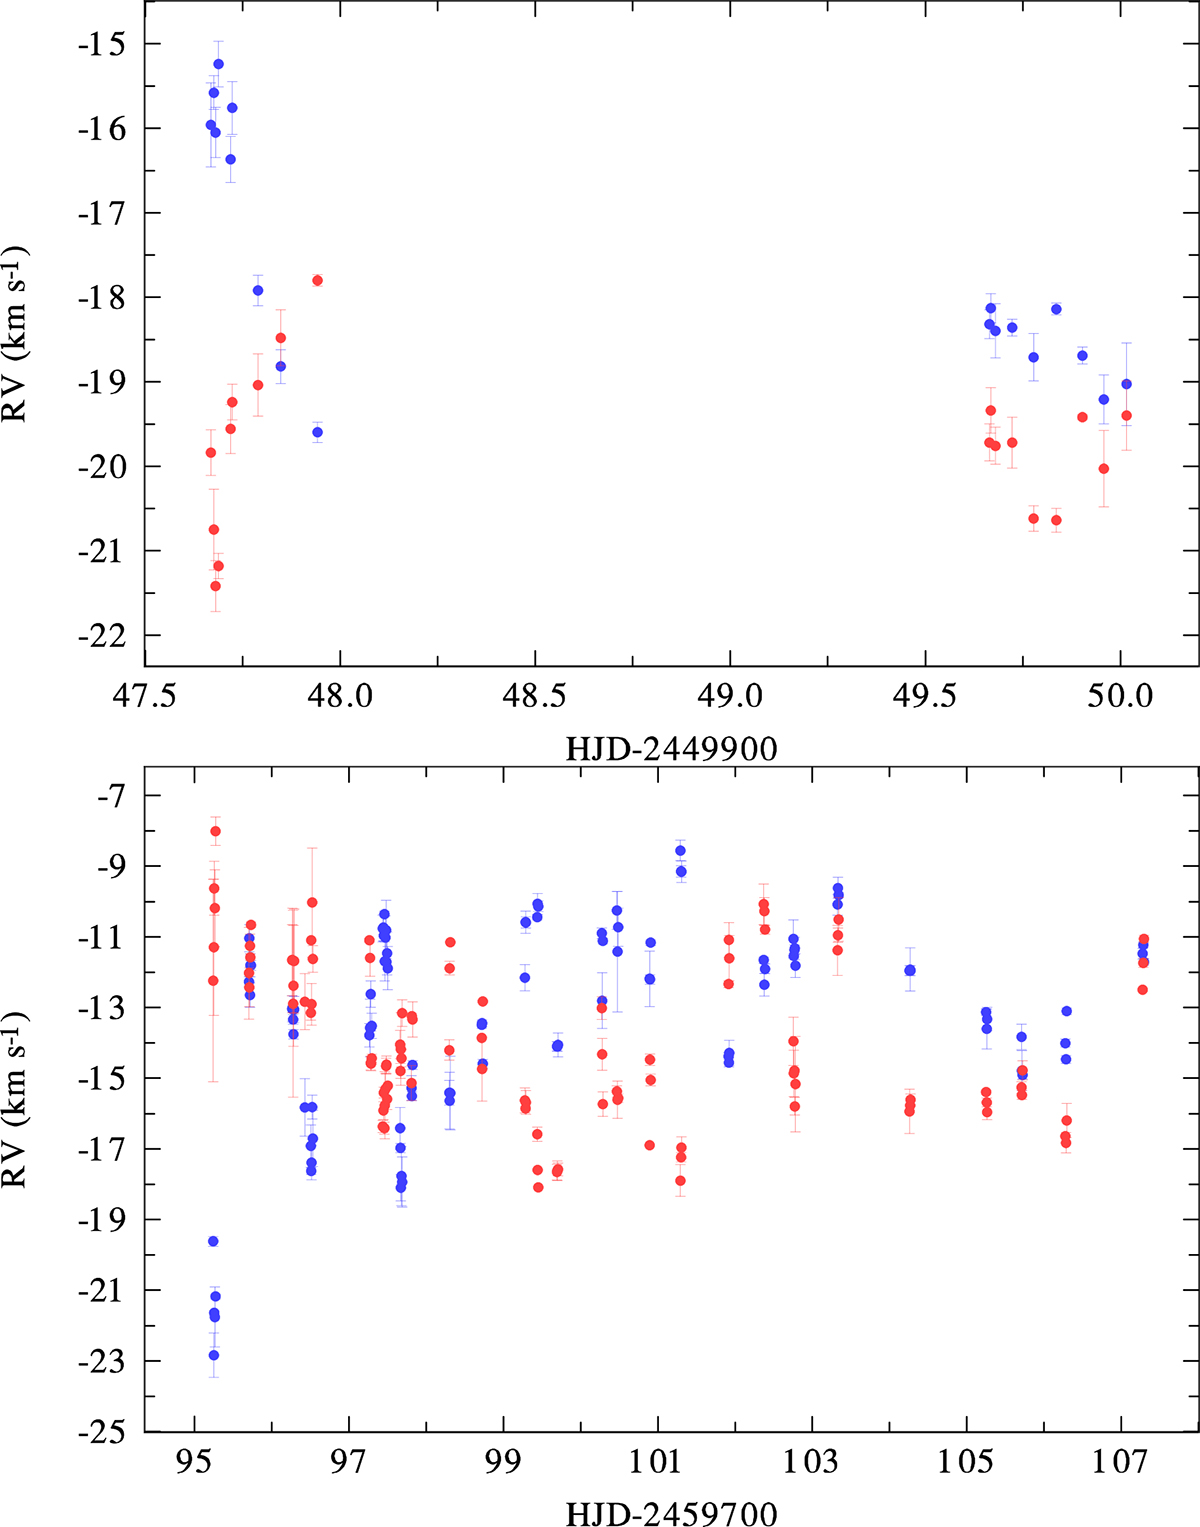
Evidence of rapid RV variations in the Hα line measured in two dense night series of spectra. RVs of the emission wings are denoted by red circles, and those of the absorption core by blue circles. The error bars of individual RVs are shown. Top: A series of DAO spectra. Bottom: A series of NRES spectra.
Current usage metrics show cumulative count of Article Views (full-text article views including HTML views, PDF and ePub downloads, according to the available data) and Abstracts Views on Vision4Press platform.
Data correspond to usage on the plateform after 2015. The current usage metrics is available 48-96 hours after online publication and is updated daily on week days.
Initial download of the metrics may take a while.