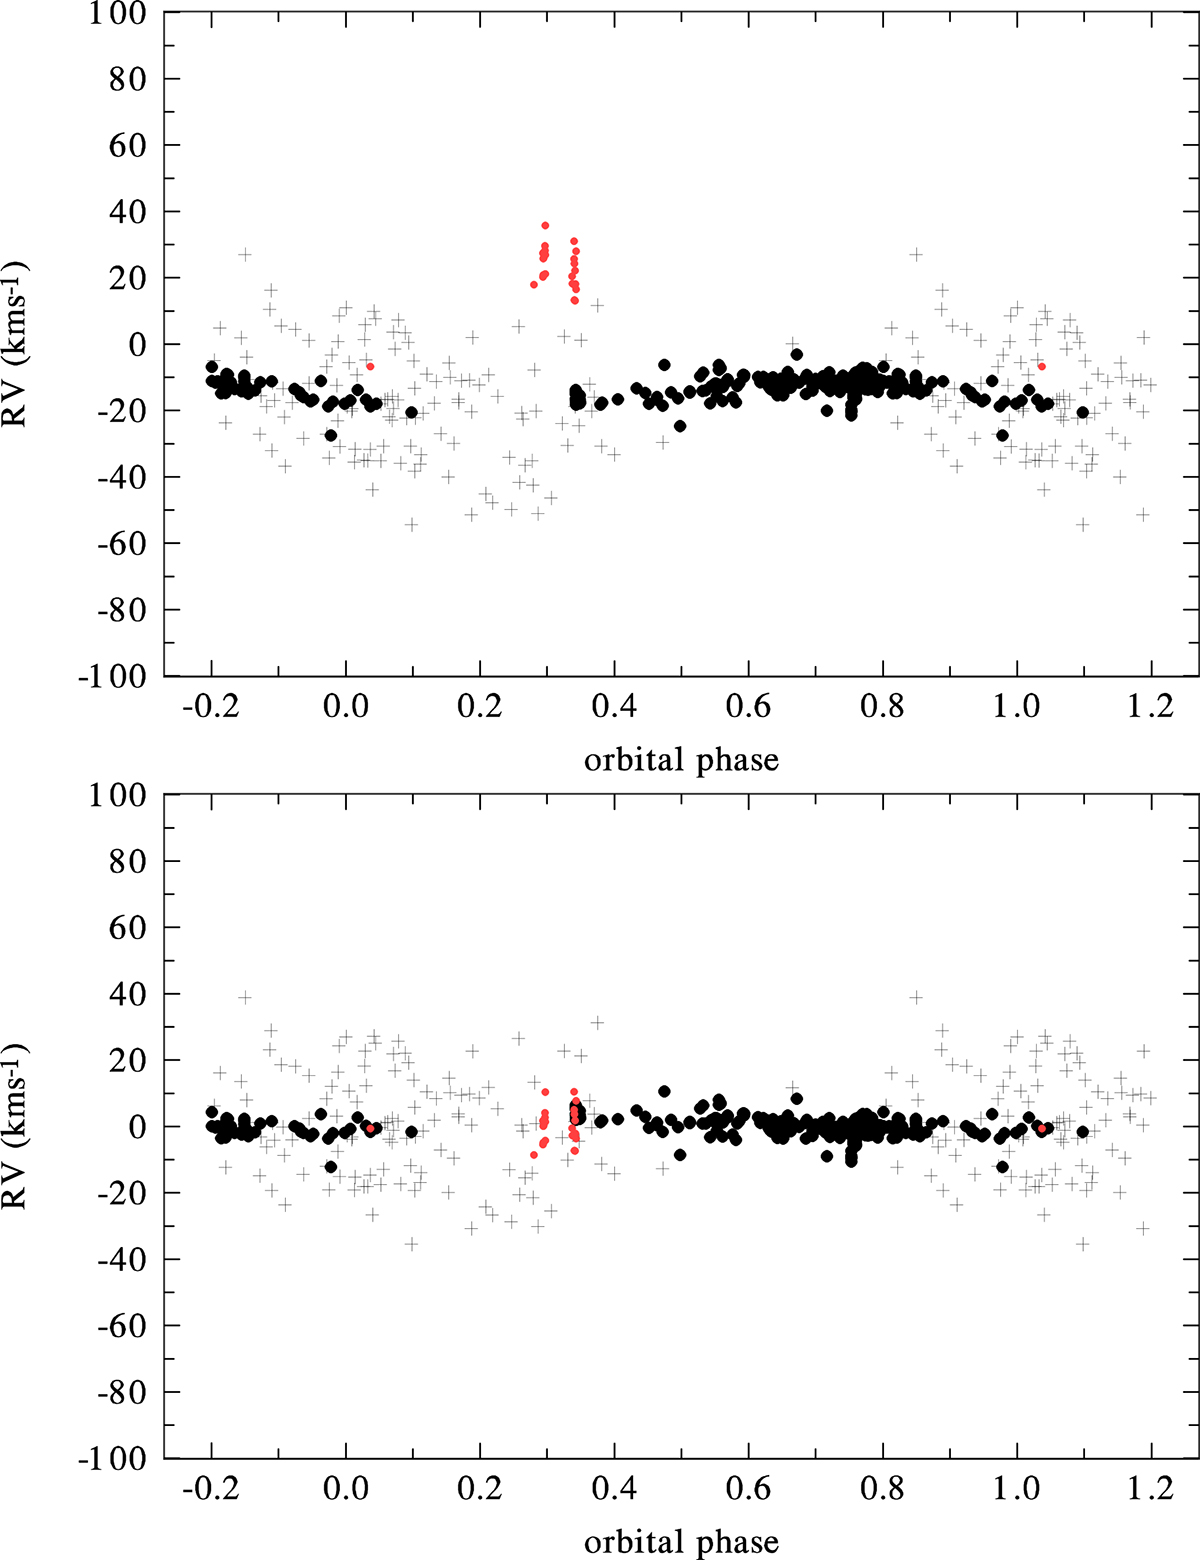
Fig. 8.
Download original image
Radial-velocity curve for the final solution (top panel) and the O − C residuals from it (bottom panel). RVs are emission-line RVs, the mean of Hβ and Hγ from the Ann Arbor photographic spectra by Losh (1932) (shown by pluses), and Hα emission wings for all CCD spectra (shown as black circles). The IUE spectra of the compact secondary, published by Wang et al. (2018), are shown by red circles.
Current usage metrics show cumulative count of Article Views (full-text article views including HTML views, PDF and ePub downloads, according to the available data) and Abstracts Views on Vision4Press platform.
Data correspond to usage on the plateform after 2015. The current usage metrics is available 48-96 hours after online publication and is updated daily on week days.
Initial download of the metrics may take a while.