Fig. 9
Download original image
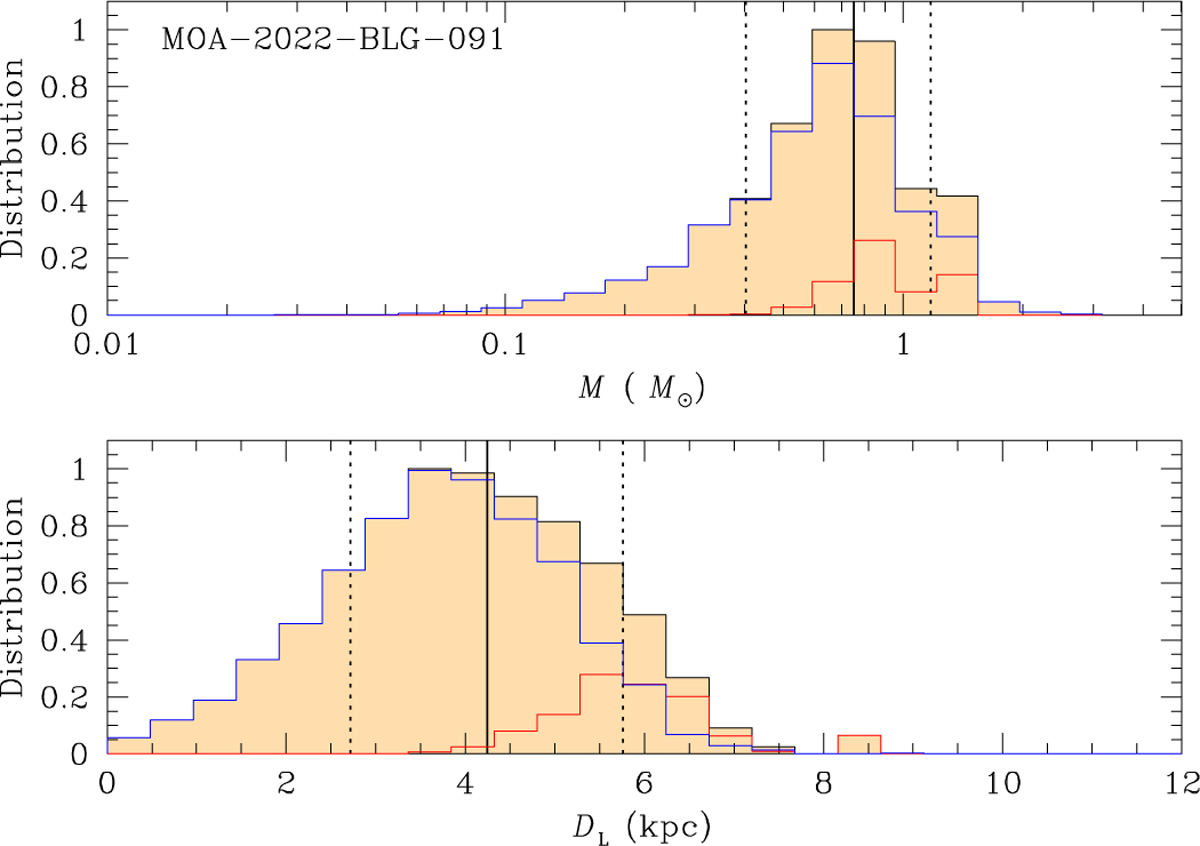
Bayesian posteriors of the lens mass (upper panel) and distance (lower panel) for MOA-2022-BLG-091. In each panel, the solid vertical line represents the median of the posterior distribution, while the two dotted lines mark the 16th and 84th percentiles of the distribution. The contributions of the disk and bulge lens populations are shown separately as blue and red curves, respectively.
Current usage metrics show cumulative count of Article Views (full-text article views including HTML views, PDF and ePub downloads, according to the available data) and Abstracts Views on Vision4Press platform.
Data correspond to usage on the plateform after 2015. The current usage metrics is available 48-96 hours after online publication and is updated daily on week days.
Initial download of the metrics may take a while.