Open Access
Fig. 3
Download original image
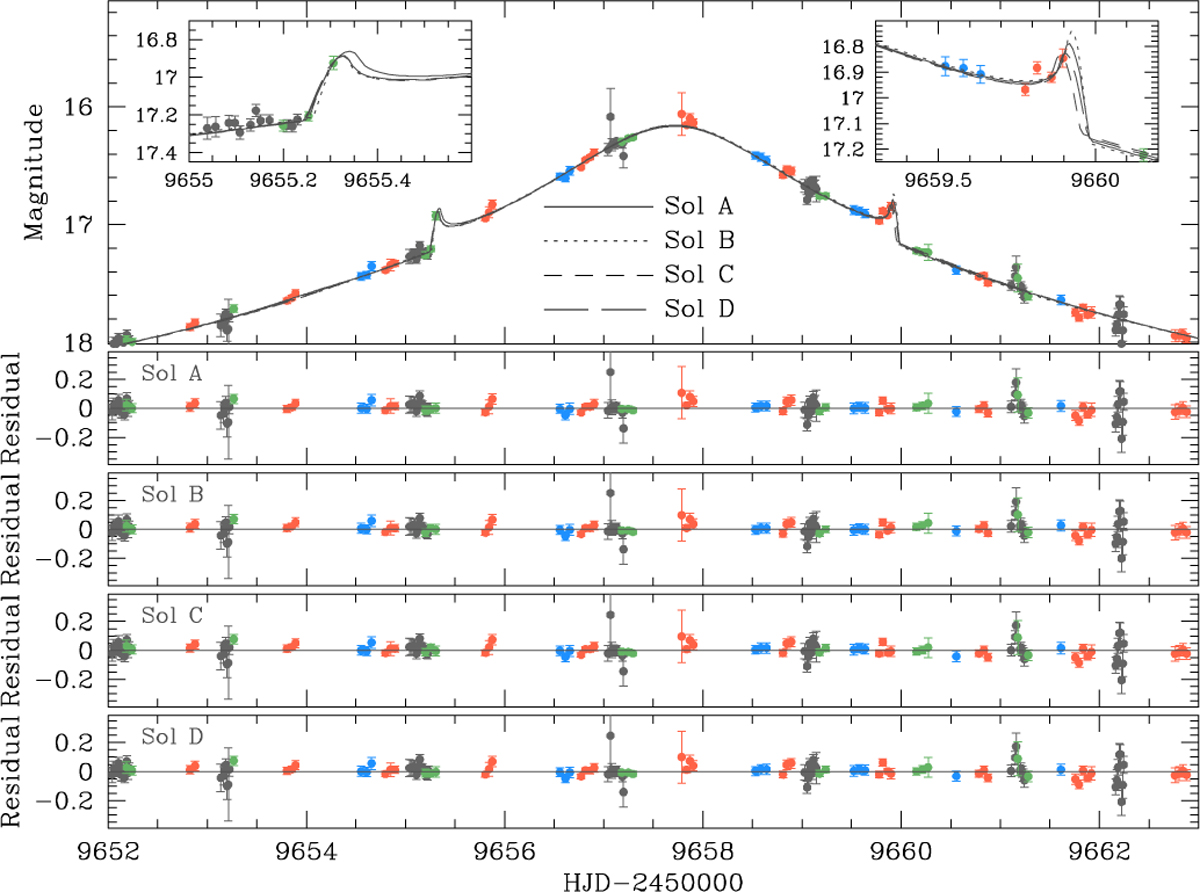
Model curves of MOA-2022-BLG-091 in the region around the anomaly. The insets in the top panel provide blowup of the regions around the anomalies induced by the source’s caustic crossings. The lower panels present the residuals corresponding to the four solutions.
Current usage metrics show cumulative count of Article Views (full-text article views including HTML views, PDF and ePub downloads, according to the available data) and Abstracts Views on Vision4Press platform.
Data correspond to usage on the plateform after 2015. The current usage metrics is available 48-96 hours after online publication and is updated daily on week days.
Initial download of the metrics may take a while.