Fig. 1
Download original image
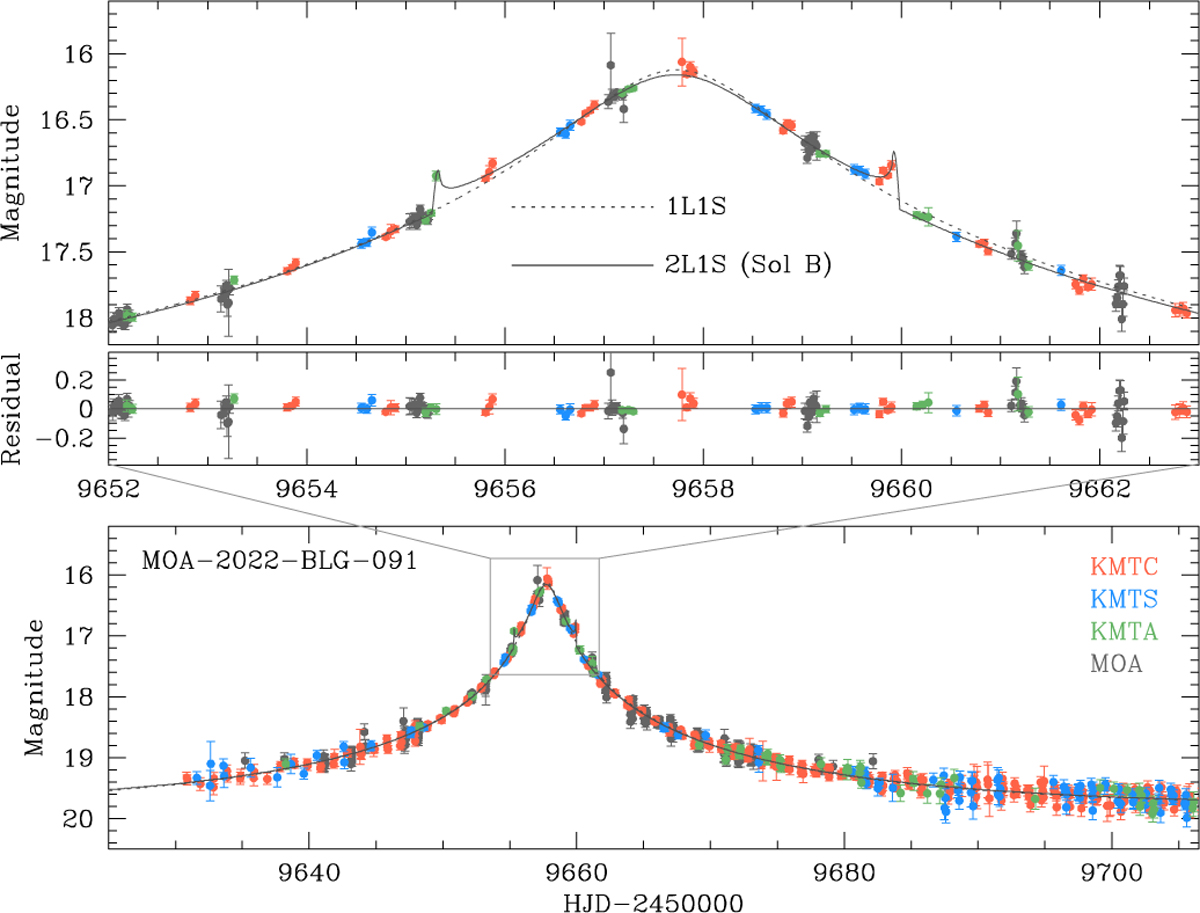
Light curve of lensing event MOA-2022-BLG-091. The lower panel displays the full light curve, while the upper panels provide a zoomed-in view of the region around the peak. The dotted and solid curves overlaid on the data points represent the 1L1S model and one of the 2L1S models (solution B), respectively. The middle panel shows the residuals from the 2L1S solution. The colors of the data points are selected to correspond with the legends.
Current usage metrics show cumulative count of Article Views (full-text article views including HTML views, PDF and ePub downloads, according to the available data) and Abstracts Views on Vision4Press platform.
Data correspond to usage on the plateform after 2015. The current usage metrics is available 48-96 hours after online publication and is updated daily on week days.
Initial download of the metrics may take a while.