Open Access
Fig. 9
Download original image
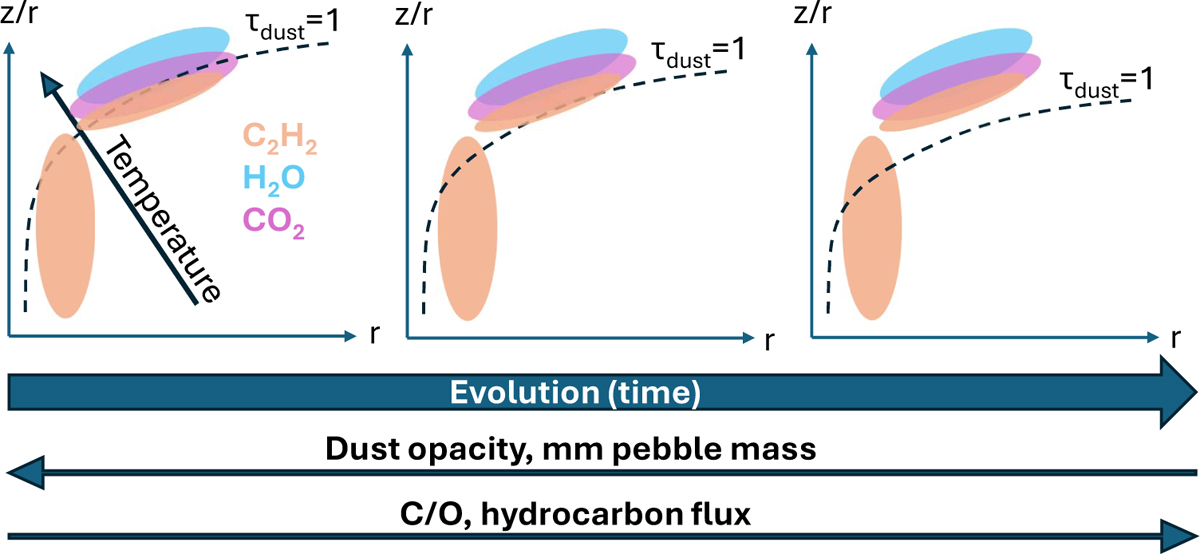
Cartoon illustrating the role of dust opacity on the mid-IR spectral appearance. The dotted line represents the τdust=1 layer. Cyan, pink, and orange ellipses represent the H2O, CO2, and the two C2H2 reservoirs. The arrows show the direction of increase in the quantity mentioned.
Current usage metrics show cumulative count of Article Views (full-text article views including HTML views, PDF and ePub downloads, according to the available data) and Abstracts Views on Vision4Press platform.
Data correspond to usage on the plateform after 2015. The current usage metrics is available 48-96 hours after online publication and is updated daily on week days.
Initial download of the metrics may take a while.