Open Access
Fig. 3
Download original image
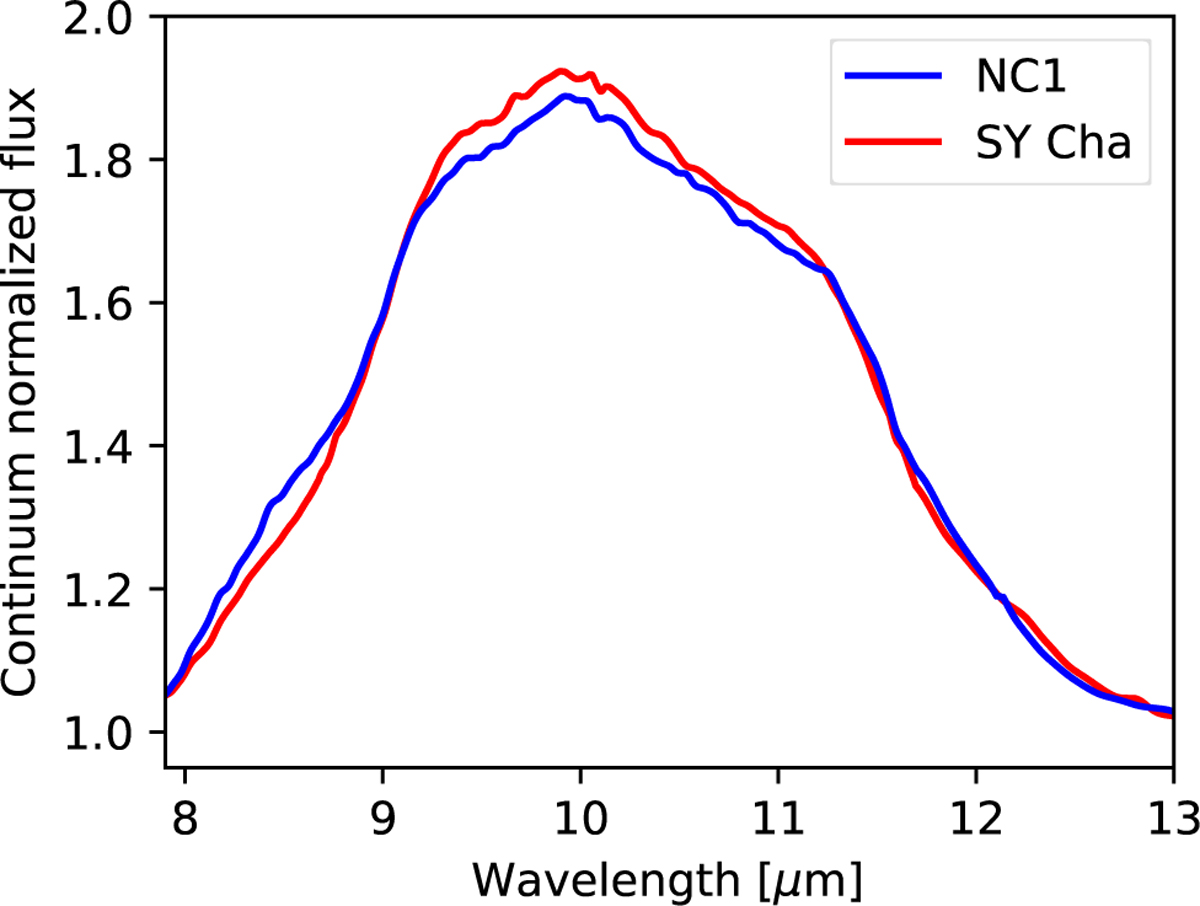
Comparison of the 10 μm dust feature of NC1 (VLMS) and SY Cha (T Tauri). Here the continuum-normalized flux is shown. The observed MIRI spectrum of SY Cha is taken from Schwarz et al. (2024).
Current usage metrics show cumulative count of Article Views (full-text article views including HTML views, PDF and ePub downloads, according to the available data) and Abstracts Views on Vision4Press platform.
Data correspond to usage on the plateform after 2015. The current usage metrics is available 48-96 hours after online publication and is updated daily on week days.
Initial download of the metrics may take a while.