Fig. 2
Download original image
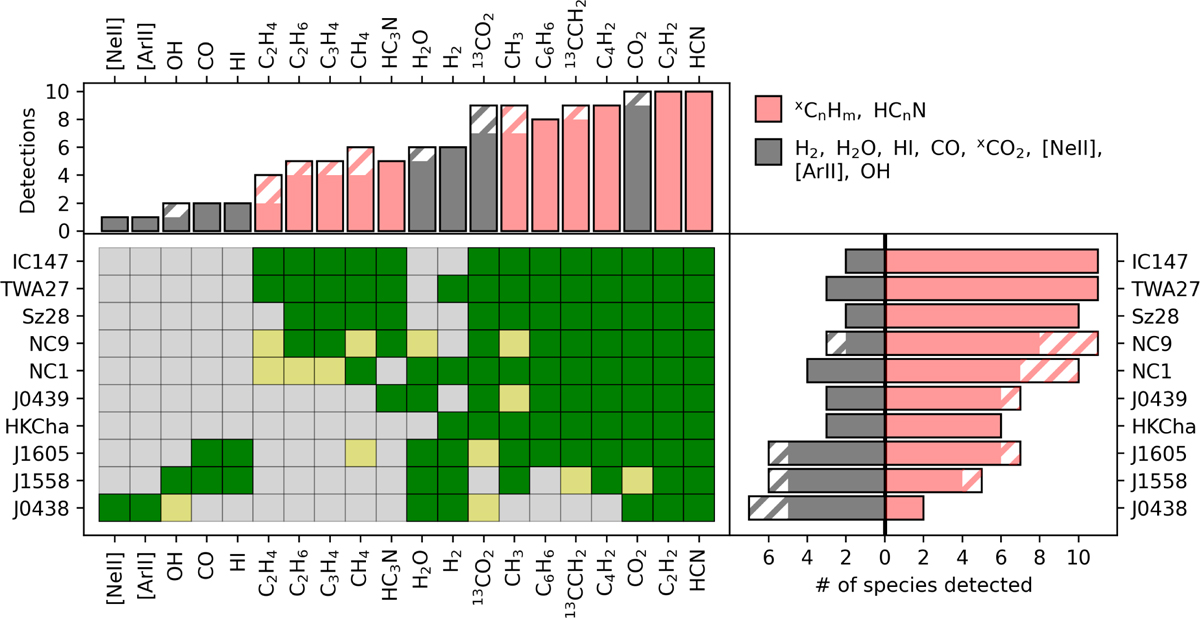
Summary of dust and gas detections in the sample. The green square refers to a firm detection, the yellow square indicates a tentative detection, and the light gray square indicates a non-detection. The top panel shows the number of detections for each species. The right panel shows the number of species of two groups detected in each source. The inorganic species (dark gray) include H2, H2O, HI, CO, CO2, 13CO2, [Ne II], and OH. The organic species (faded red) include all the hydrocarbons and cyanomolecules. The hatched region in the top and right panels shows tentative detections.
Current usage metrics show cumulative count of Article Views (full-text article views including HTML views, PDF and ePub downloads, according to the available data) and Abstracts Views on Vision4Press platform.
Data correspond to usage on the plateform after 2015. The current usage metrics is available 48-96 hours after online publication and is updated daily on week days.
Initial download of the metrics may take a while.