Open Access
Fig. C.4
Download original image
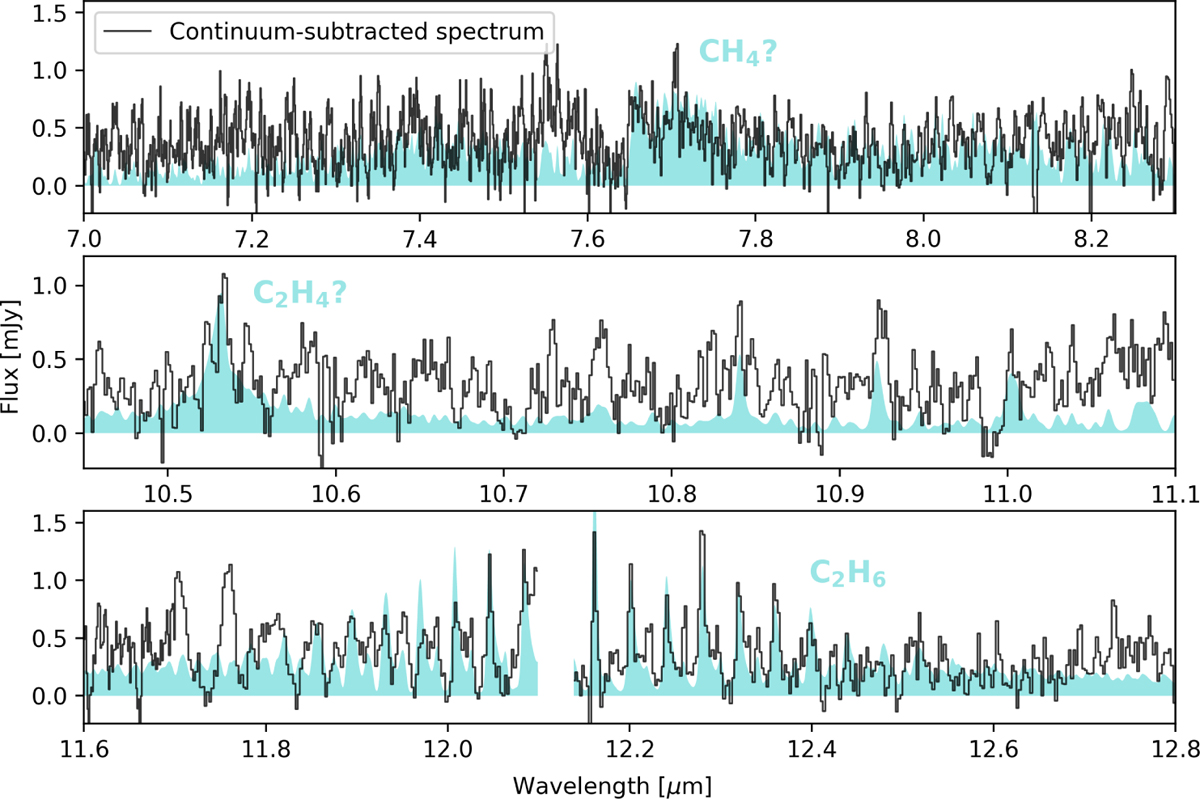
Detections of molecular emission in NC9. The continuum-subtracted MIRI spectrum is shown in black. The different molecular emissions are shown using slab model spectra as color-filled regions in each panel. The question mark (?) indicates that additional modeling is needed to confirm the detection.
Current usage metrics show cumulative count of Article Views (full-text article views including HTML views, PDF and ePub downloads, according to the available data) and Abstracts Views on Vision4Press platform.
Data correspond to usage on the plateform after 2015. The current usage metrics is available 48-96 hours after online publication and is updated daily on week days.
Initial download of the metrics may take a while.