Fig. C.1
Download original image
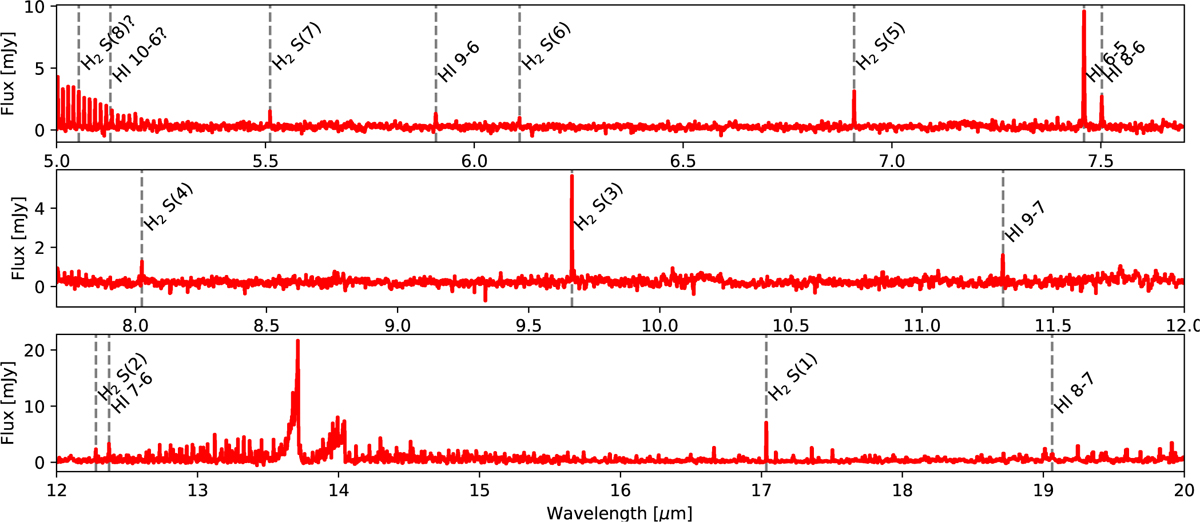
Detections of atomic and molecular hydrogen lines in the J1558 spectrum. The continuum-subtracted MIRI spectrum is shown in red. The atomic and molecular hydrogen lines are marked by vertical dashed lines and are labeled. The two lines with question marks indicate line emissions that could be possibly blended with CO ro-vibration lines.
Current usage metrics show cumulative count of Article Views (full-text article views including HTML views, PDF and ePub downloads, according to the available data) and Abstracts Views on Vision4Press platform.
Data correspond to usage on the plateform after 2015. The current usage metrics is available 48-96 hours after online publication and is updated daily on week days.
Initial download of the metrics may take a while.