Fig. E.2
Download original image
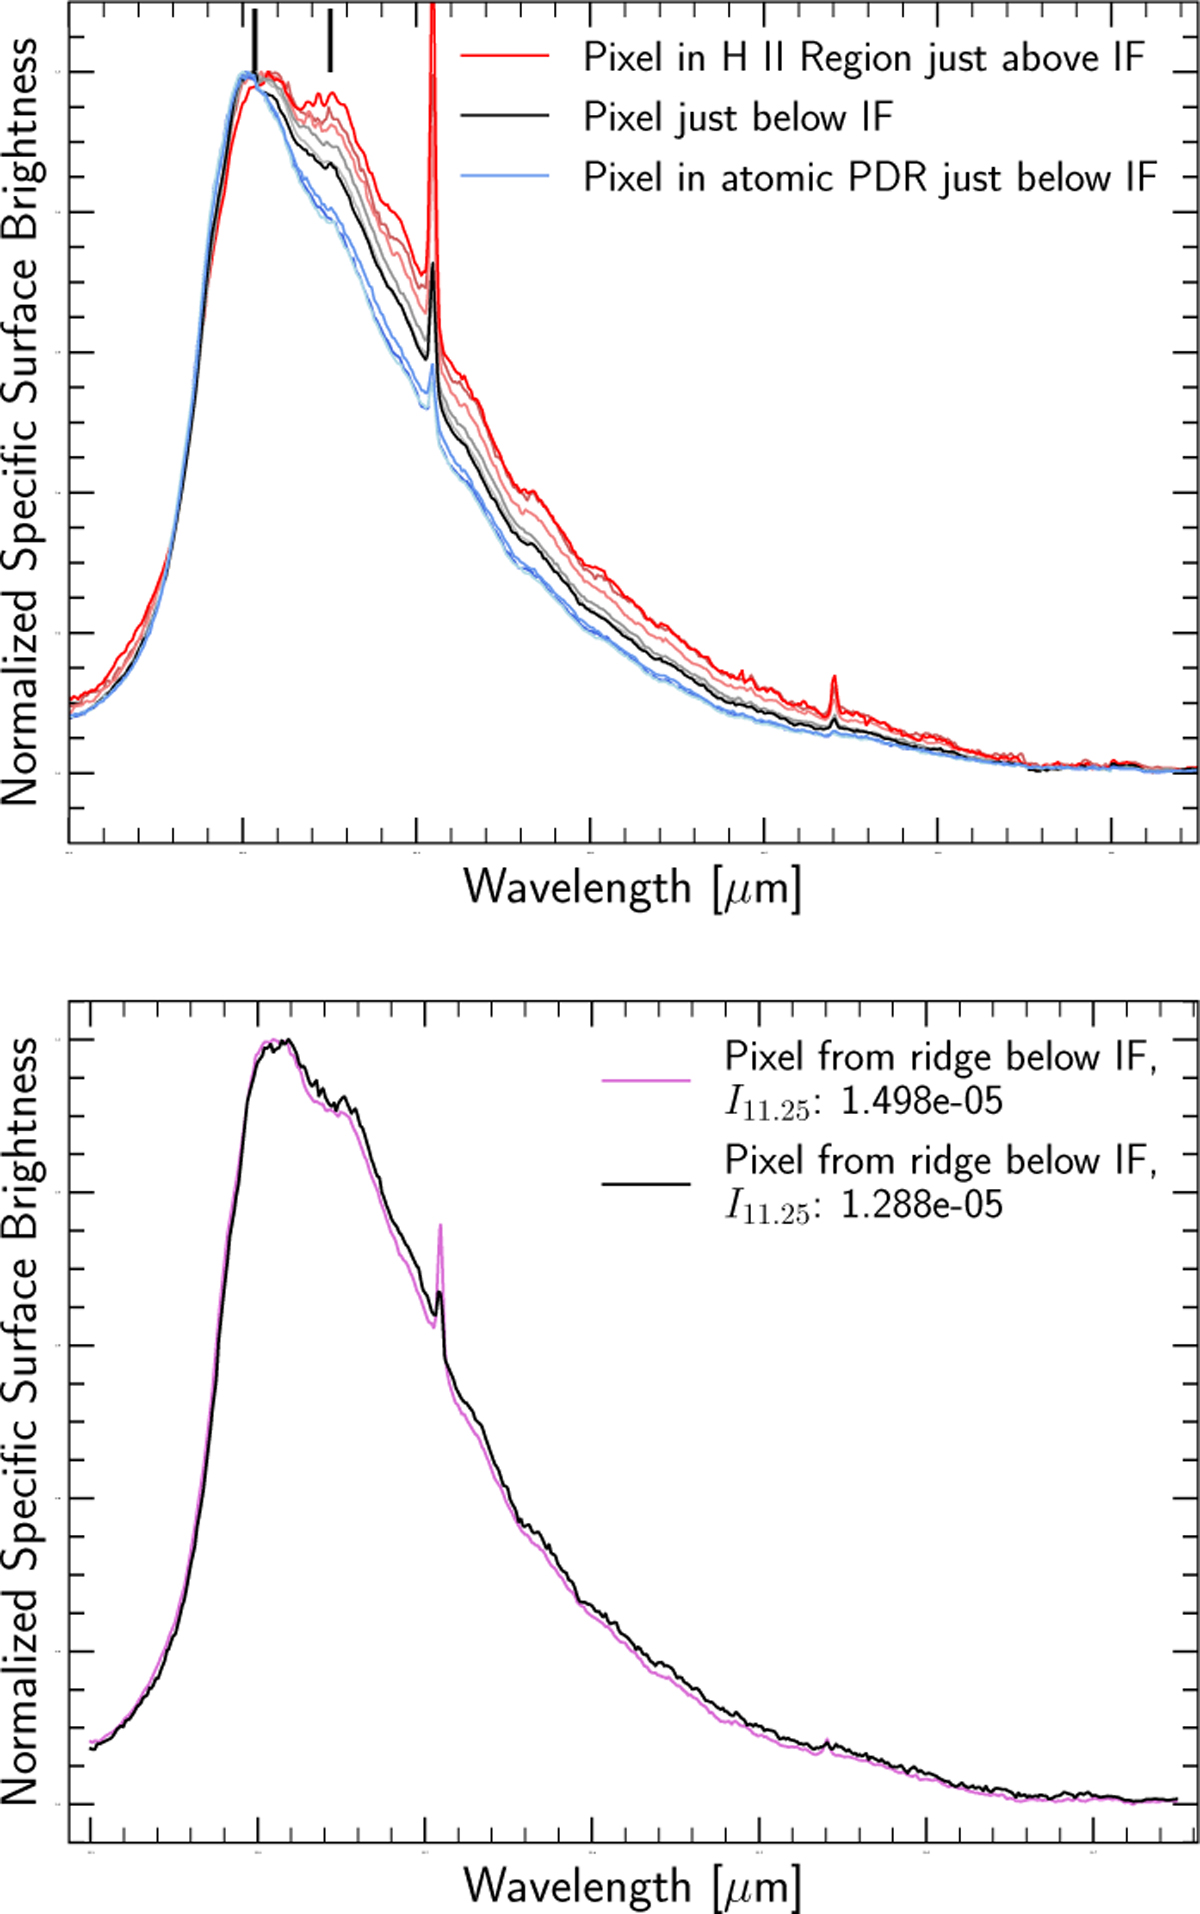
Illustration of the 11.2 µm profiles normalized to their peak specific surface brightnesses near the IF. Top: profiles, in groups of three, of the pixels that are marked by ⋆ symbols on the 11.25 µm map in Fig. E.1. Bottom: profiles from a pixel marked by a × symbol in purple near the IF and a pixel marked by a × symbol in black DF 2 in the 11.25 µm map in Fig. E.1.
Current usage metrics show cumulative count of Article Views (full-text article views including HTML views, PDF and ePub downloads, according to the available data) and Abstracts Views on Vision4Press platform.
Data correspond to usage on the plateform after 2015. The current usage metrics is available 48-96 hours after online publication and is updated daily on week days.
Initial download of the metrics may take a while.