Fig. 4
Download original image
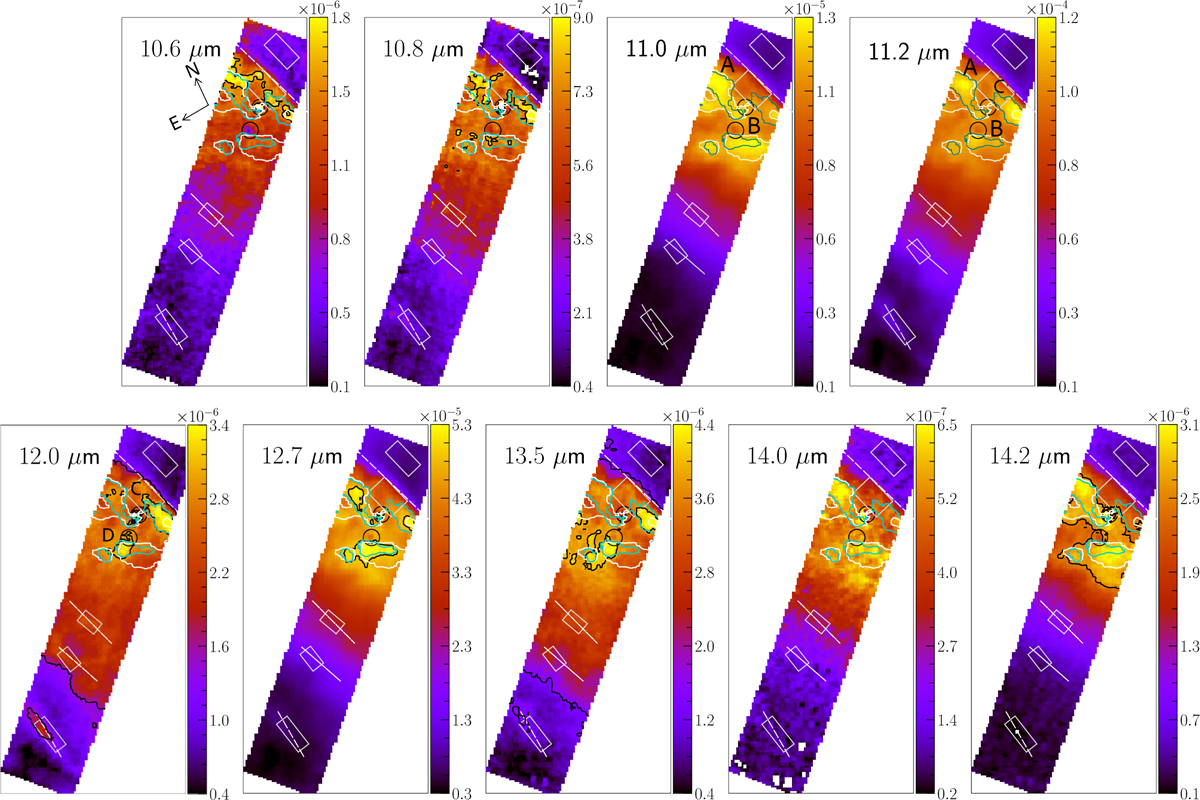
Spatial variation in the surface brightnesses of the 10–15 µm AIBs in the Orion Bar PDR, in units of W m−2 sr−1. θ1 Ori C is located toward the top right of each map (see Fig. 2). For each map, the range of the corresponding color bar is set between 0.5% and 99.5% percentile level for the data, while zero pixels, edge pixels, and pixels covering the two proplyds, indicated by the black circles, are masked out. The contours trace peak emission for the 11.0 µm AIB (white), the 11.2 µm AIB (teal), and the specific AIB shown in the panel (black). The black letters in selected panels label the most notable structures, which are discussed in the text. The rectangular apertures of the template spectra for the H II region, atomic PDR, DF 1, DF 2 and DF 3, from top to bottom, are shown in white and the solid white lines delineate the IF and the three dissociation fronts, DF 1, DF 2 and DF 3.
Current usage metrics show cumulative count of Article Views (full-text article views including HTML views, PDF and ePub downloads, according to the available data) and Abstracts Views on Vision4Press platform.
Data correspond to usage on the plateform after 2015. The current usage metrics is available 48-96 hours after online publication and is updated daily on week days.
Initial download of the metrics may take a while.