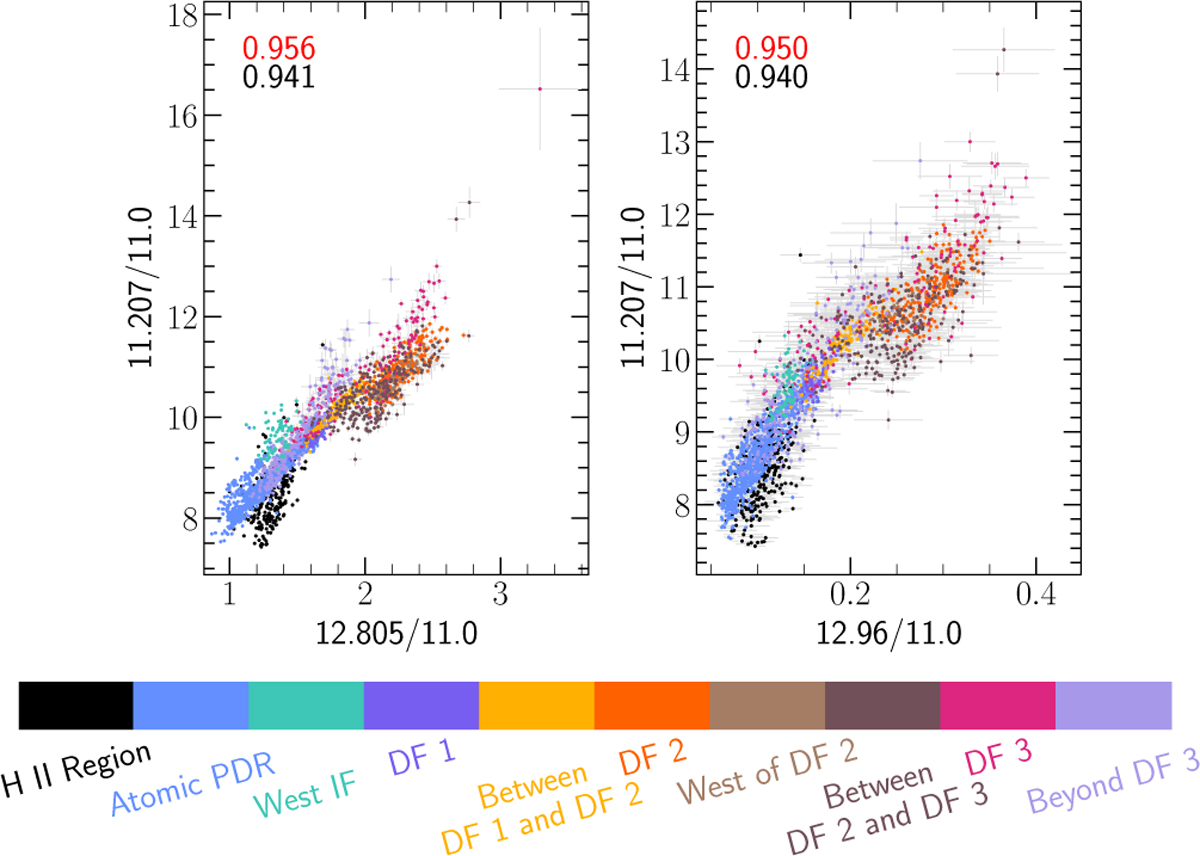
Fig. C.3
Download original image
Correlations of the 12.805 and 12.96 µm surface brightnesses with the 11.207 µm surface brightnesses, normalized to the 11.0 µm surface brightnesses. The correlation coefficient, R, for the variables excluding and including the points from the H II region are listed in red and black, respectively. The data points are colored according to regions in the mosaic where those pixels are located, per the color bar at the bottom.
Current usage metrics show cumulative count of Article Views (full-text article views including HTML views, PDF and ePub downloads, according to the available data) and Abstracts Views on Vision4Press platform.
Data correspond to usage on the plateform after 2015. The current usage metrics is available 48-96 hours after online publication and is updated daily on week days.
Initial download of the metrics may take a while.