Fig. 28
Download original image
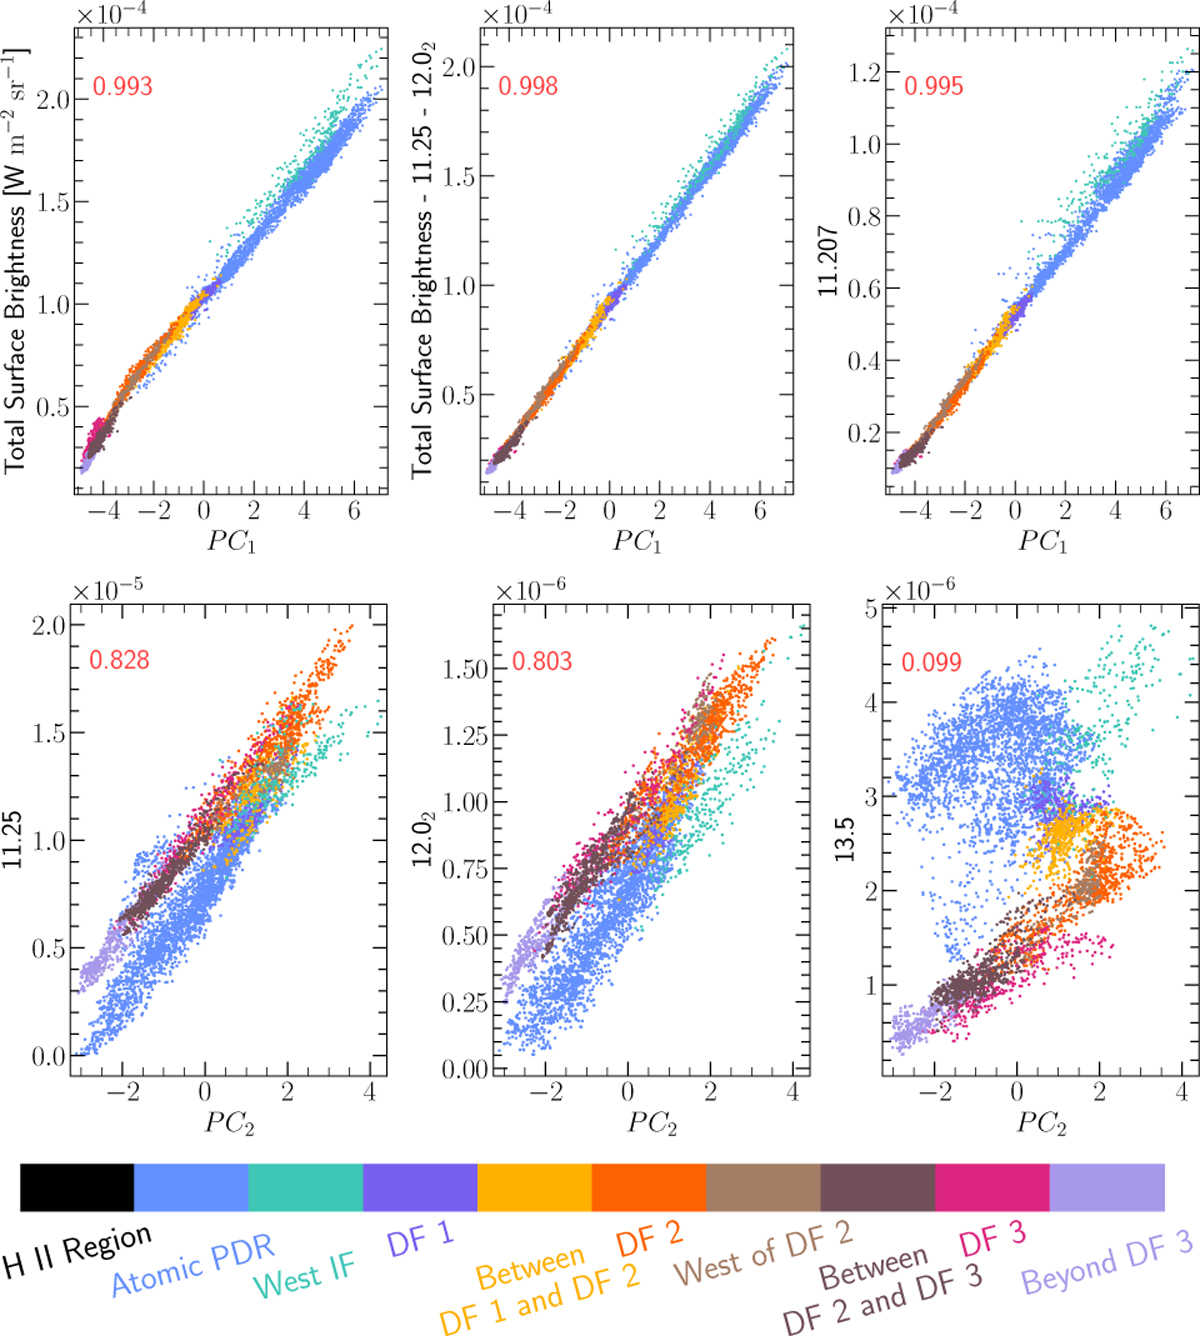
Top panel: Correlations of PC1 with the total surface brightness i.e., the sum of the surface brightnesses of all the AIBs (left), with the total surface brightness without contributions from the 11.25 µm and µm components (middle), and the 11.207 µm AIB surface brightnesses (right). Middle panel: From left to right, correlations of PC2 with the 11.25 µm, 12.02 µm and 13.5 µm AIB surface brightnesses. Bottom panel: The data points are colored according to regions in the mosaic where those pixels are located, per the color bar.
Current usage metrics show cumulative count of Article Views (full-text article views including HTML views, PDF and ePub downloads, according to the available data) and Abstracts Views on Vision4Press platform.
Data correspond to usage on the plateform after 2015. The current usage metrics is available 48-96 hours after online publication and is updated daily on week days.
Initial download of the metrics may take a while.