Open Access
Fig. 24
Download original image
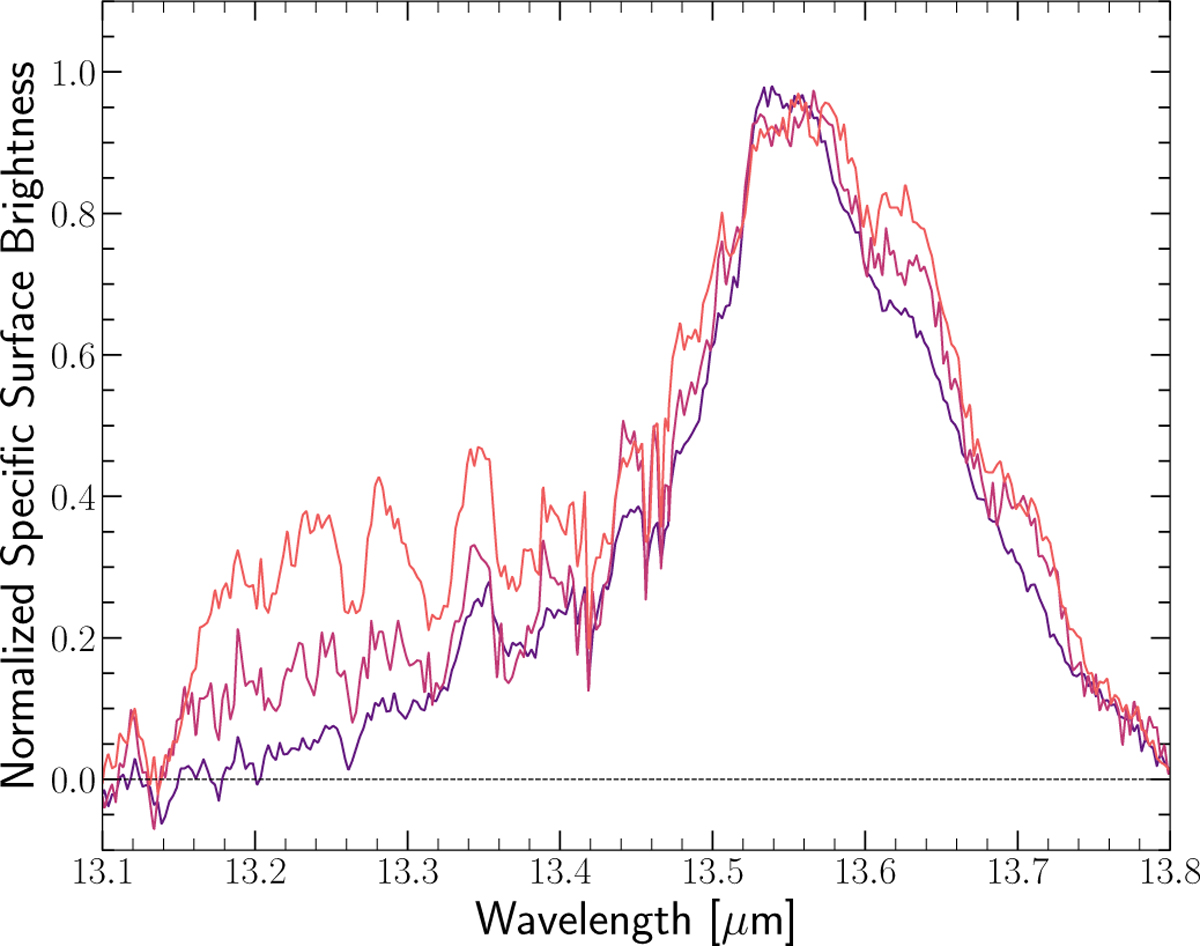
Profile variations in the 13.5 µm AIB, in the Orion bar. Spectra from consecutive pixels were averaged and three of these averaged profiles are presented. Deeper into the molecular cloud, toward the DF 3 (orange spectrum), additional components emerge around ∼13.2 µm and ∼13.55 µm.
Current usage metrics show cumulative count of Article Views (full-text article views including HTML views, PDF and ePub downloads, according to the available data) and Abstracts Views on Vision4Press platform.
Data correspond to usage on the plateform after 2015. The current usage metrics is available 48-96 hours after online publication and is updated daily on week days.
Initial download of the metrics may take a while.