Fig. 2
Download original image
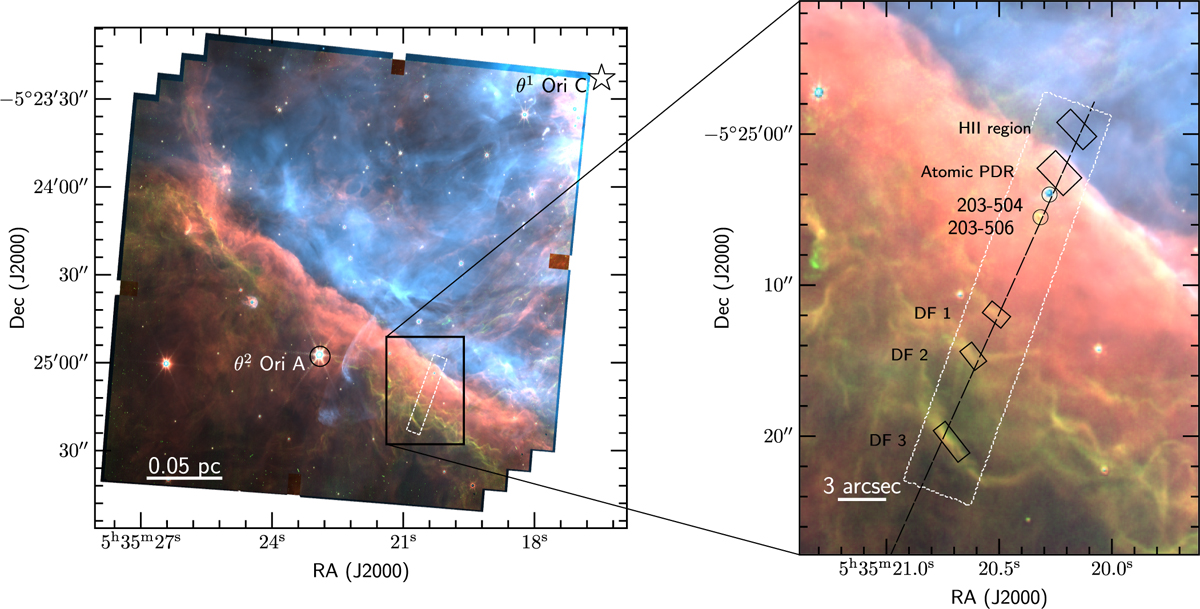
Composite JWST NIRCam image of the Orion Bar. The JWST-MIRI/MRS IFU FOV is overlaid in white, and the spectral extraction apertures for the five template spectra are indicated with labels and black boxes in the right panel. The red, green, and blue colors encode the F335M (the 3.3 µm AIB), F470N-F444W (H2 emission), and F187N (Paschen α emission), respectively Habart et al. (2024). The ionizing source for the Orion Bar, θ1 Ori C, is represented by the ⋆ symbol on the top right edge of the left panel. In the right panel, the two proplyds 203-504 and 203-506 are shown through black circles, and the dashed black line indicates the cut across the MIRI mosaic (position angle, PA, of 155.79°). This figure is adapted from Chown et al. (2024), with permission.
Current usage metrics show cumulative count of Article Views (full-text article views including HTML views, PDF and ePub downloads, according to the available data) and Abstracts Views on Vision4Press platform.
Data correspond to usage on the plateform after 2015. The current usage metrics is available 48-96 hours after online publication and is updated daily on week days.
Initial download of the metrics may take a while.