Fig. 17
Download original image
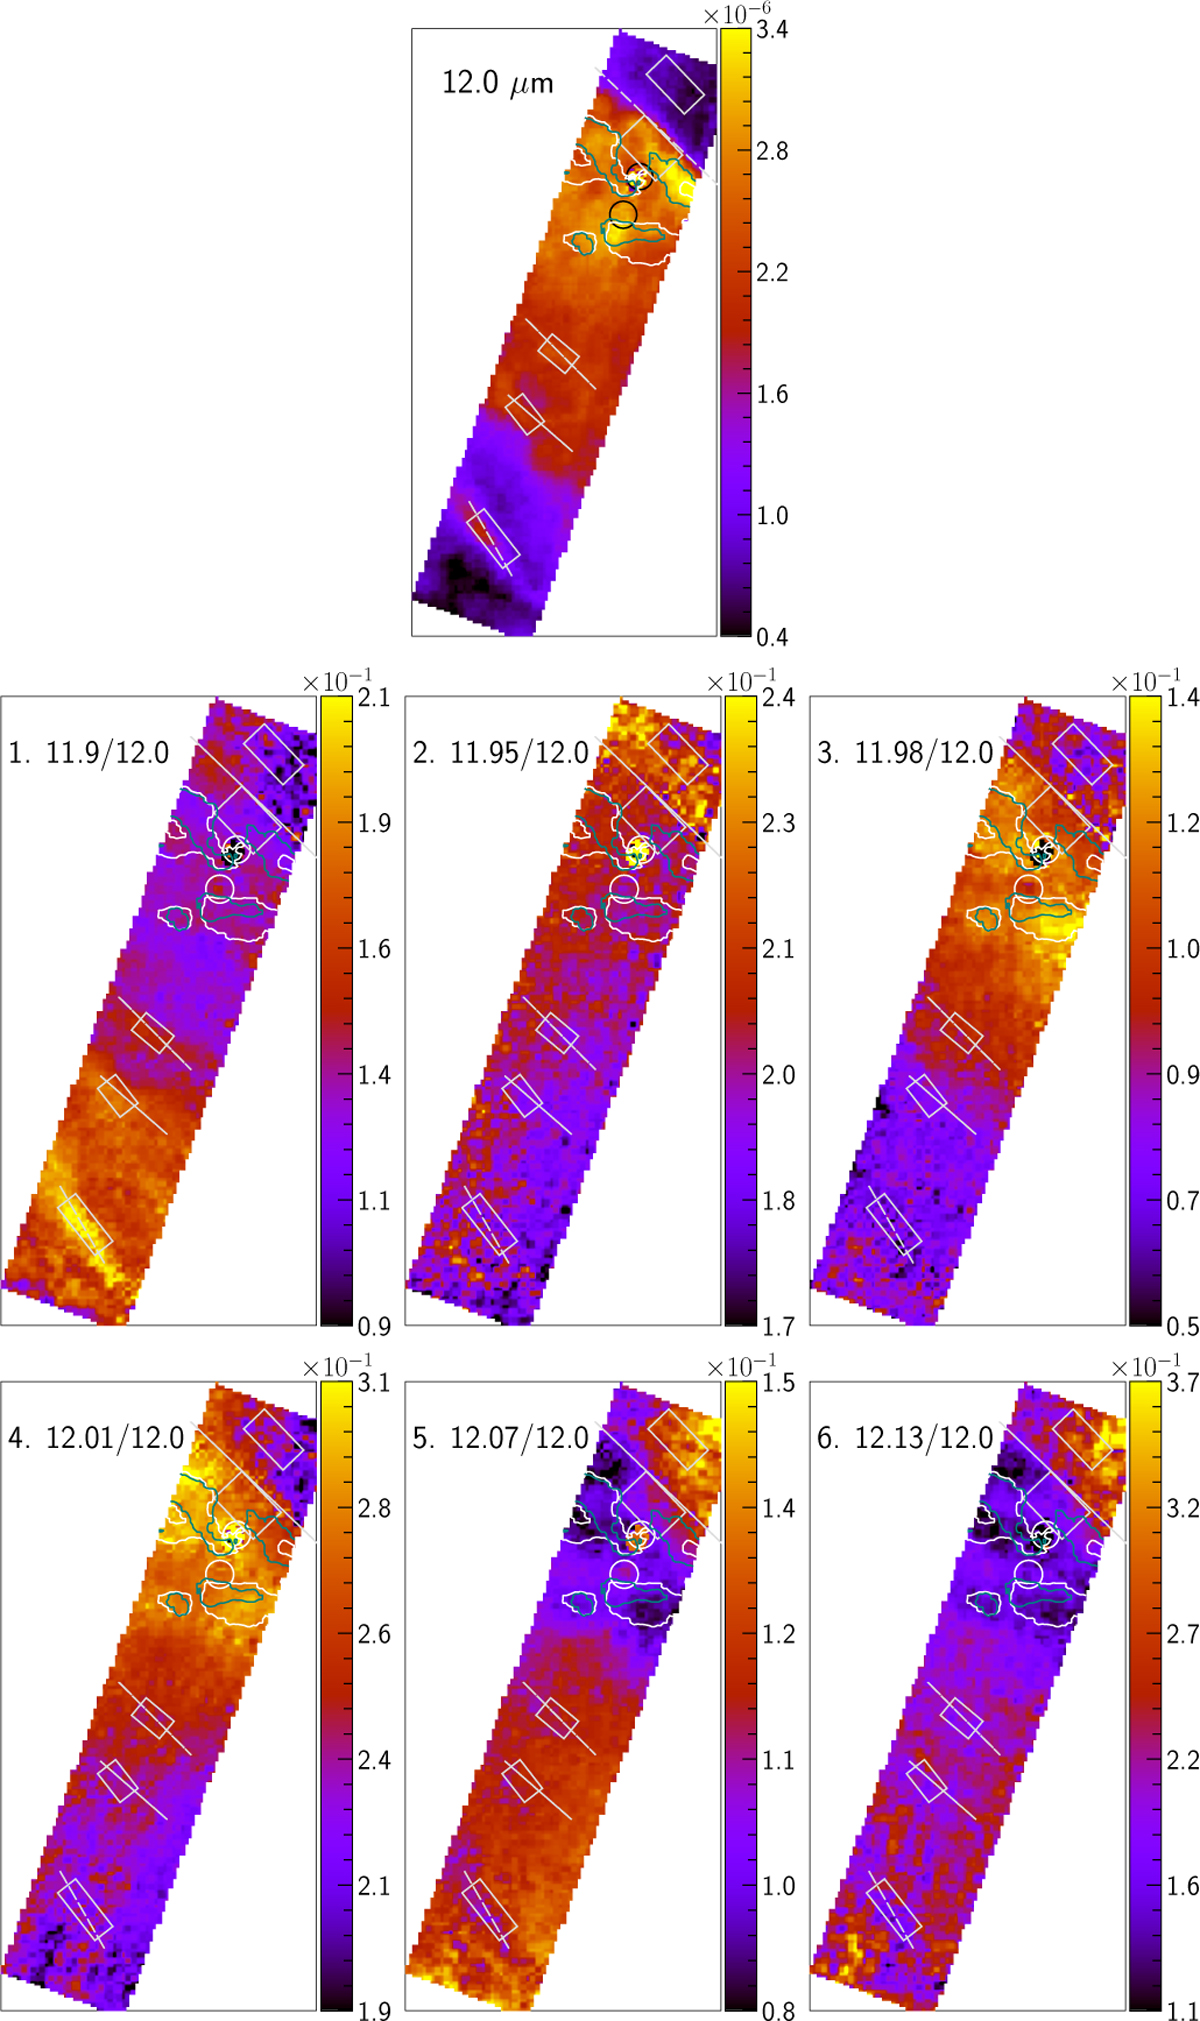
Morphology of the 12.0 µm AIB surface brightness and its components relative to the total integrated 12.0 µm AIB. The white and teal contours trace peak emission for the 11.0 and 11.2 µm AIBs, respectively. The map visualization conventions are described in Fig. 13. Near proplyd 1, the decomposition was unsuccessful, hence the lack of data.
Current usage metrics show cumulative count of Article Views (full-text article views including HTML views, PDF and ePub downloads, according to the available data) and Abstracts Views on Vision4Press platform.
Data correspond to usage on the plateform after 2015. The current usage metrics is available 48-96 hours after online publication and is updated daily on week days.
Initial download of the metrics may take a while.