Fig. 16
Download original image
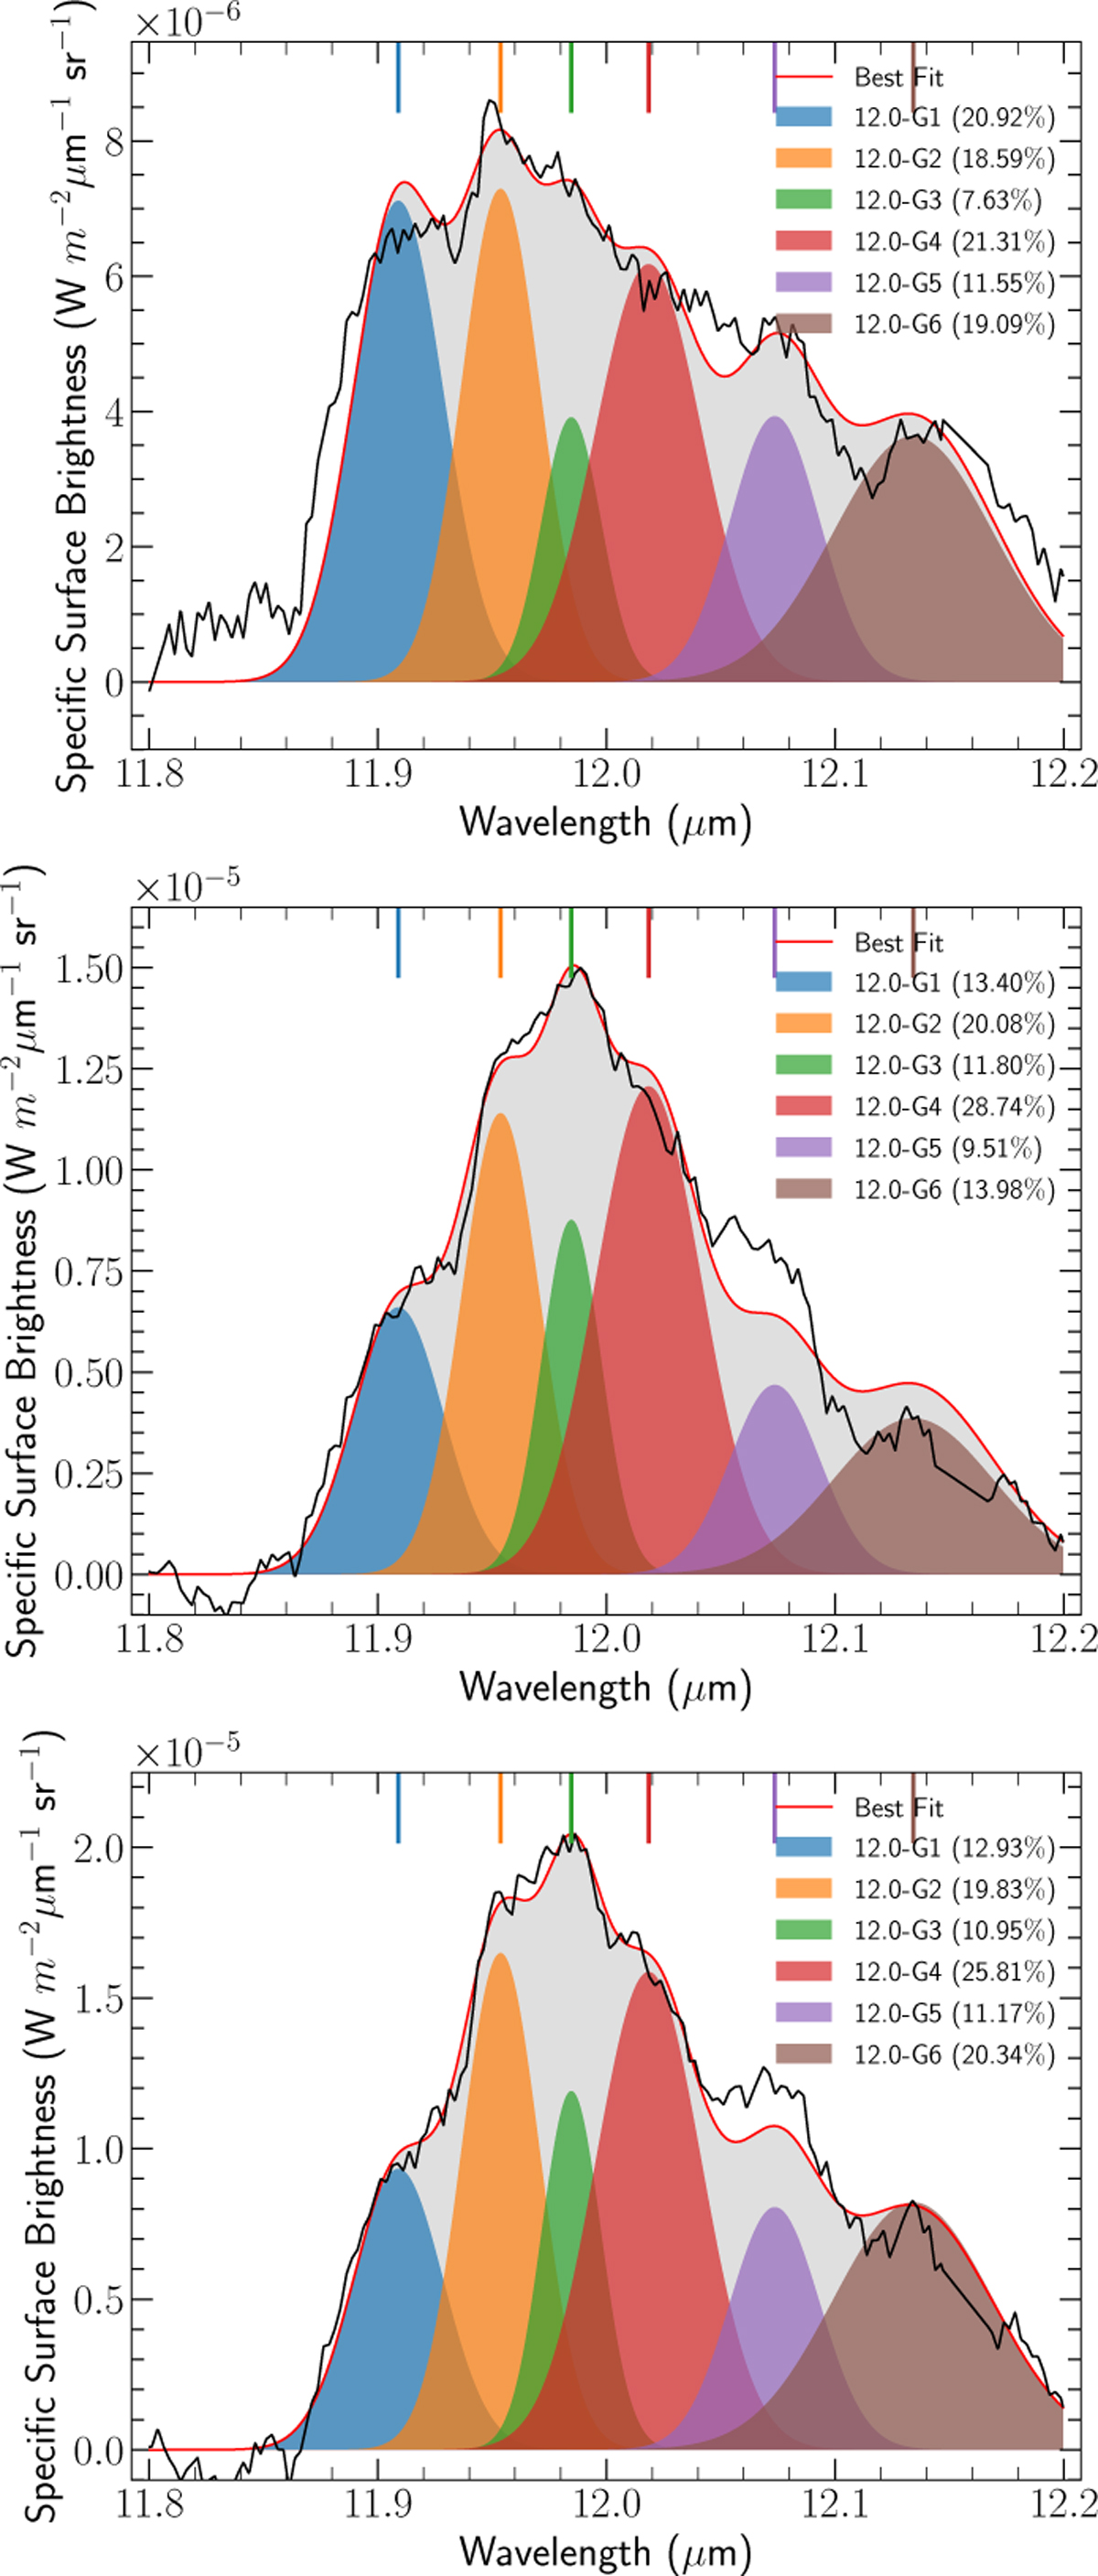
12.0 µm decomposition for three selected spaxels from DF 2, the middle of the atomic PDR and near the IF. The vertical colored lines indicate the central positions of the six components (Table A.1). The percent fractional contribution of the specific surface brightness carried by each component to the total 12.0 µm surface brightness is indicated in parentheses.
Current usage metrics show cumulative count of Article Views (full-text article views including HTML views, PDF and ePub downloads, according to the available data) and Abstracts Views on Vision4Press platform.
Data correspond to usage on the plateform after 2015. The current usage metrics is available 48-96 hours after online publication and is updated daily on week days.
Initial download of the metrics may take a while.