Fig. 9
Download original image
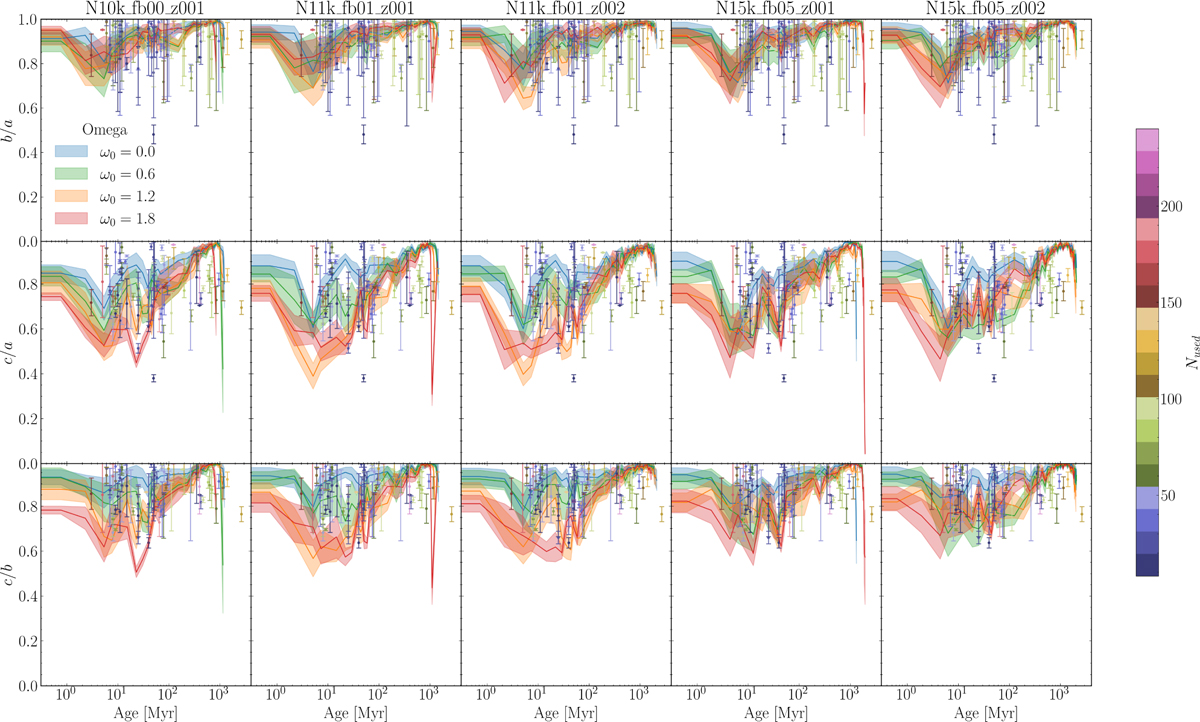
Evolution of principal axis ratios of the simulated clusters with age. The areas shaded in light colors enclose the minimum and maximum values from bootstrapping as a function of time, for intermediate-to-major axis ratio b/a (upper row), the minor-to-major axis ratio c/a (middle row), and the minor-to-intermediate axis ratio c/b (bottom row). Columns show the results of the different models (indicated at the top). The colors of the shaded areas indicate the bootstrap range for models with different ω0. Symbols with error bars indicate the principal axis ratios for observations calculated from the members of the star clusters studied in Pang et al. (2021, 2022b, 2024).
Current usage metrics show cumulative count of Article Views (full-text article views including HTML views, PDF and ePub downloads, according to the available data) and Abstracts Views on Vision4Press platform.
Data correspond to usage on the plateform after 2015. The current usage metrics is available 48-96 hours after online publication and is updated daily on week days.
Initial download of the metrics may take a while.