Open Access
Fig. 2
Download original image
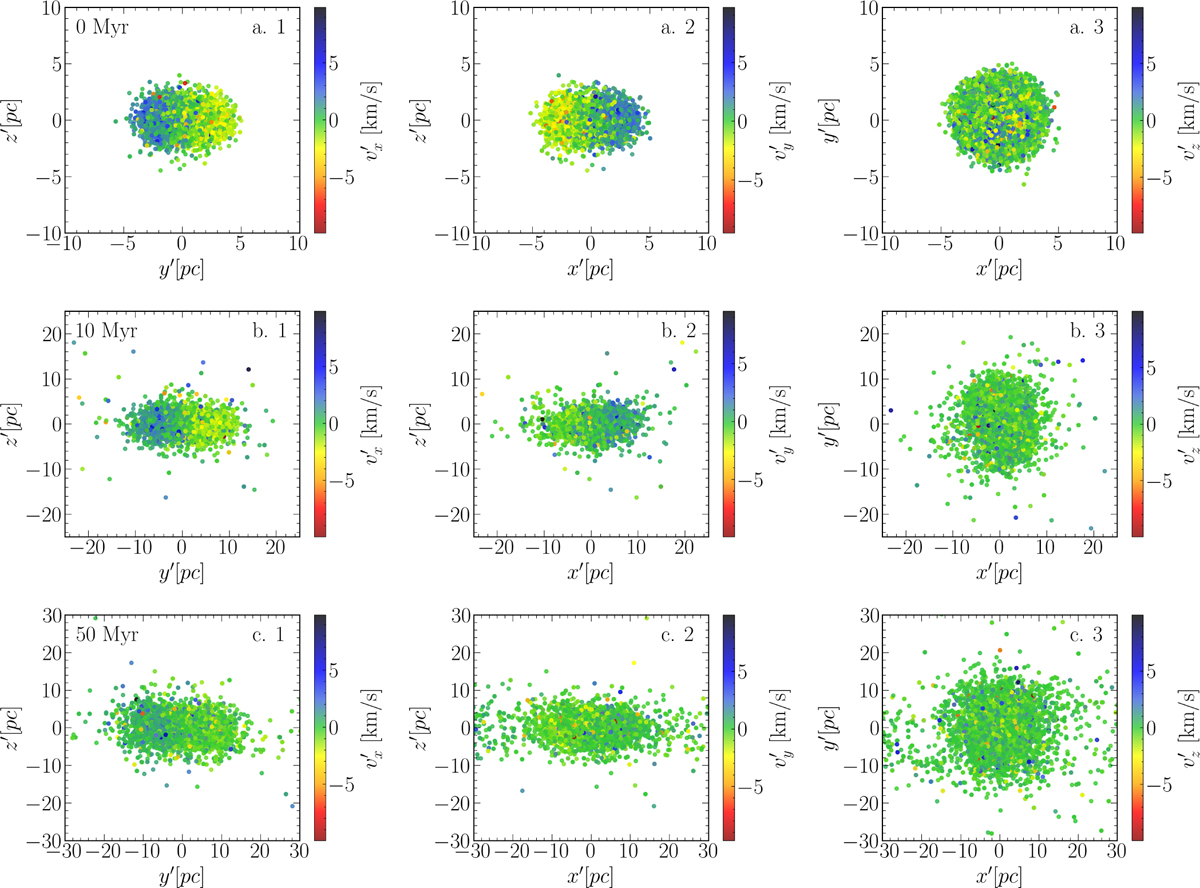
Spatial coordinates for the model with ω0 = 1.8 at 0Myr (panel a), 10 Myr (panel b), and 50 Myr (panel c). The color map shows the component of the stellar velocity along the x′-, y′-, and z′-axes (where the z′ axis is the direction of the net angular momentum).
Current usage metrics show cumulative count of Article Views (full-text article views including HTML views, PDF and ePub downloads, according to the available data) and Abstracts Views on Vision4Press platform.
Data correspond to usage on the plateform after 2015. The current usage metrics is available 48-96 hours after online publication and is updated daily on week days.
Initial download of the metrics may take a while.